| 
					
					
					 SHALLOW GAS SAND WITH COAL This case history shows a number of obvious
					and not so obvious features of petrophysical analysis in
					sands and shaly sands. The obvious is the clean sand with a
					minor amount of
					crossover on the density neutron log.
					Combined with the high resistivity, there is no doubt that
					this is a gas zone. Both SP and GR show the clean sand.
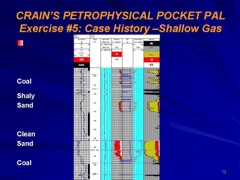
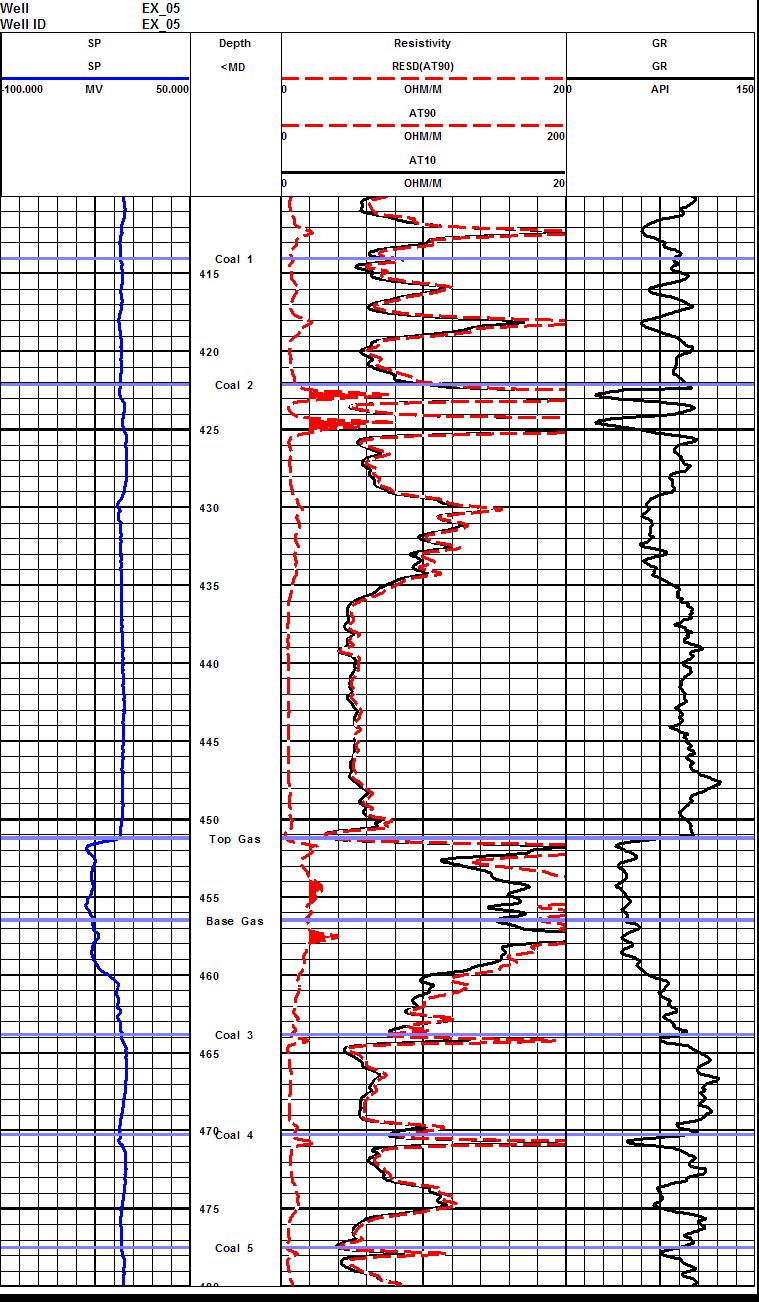
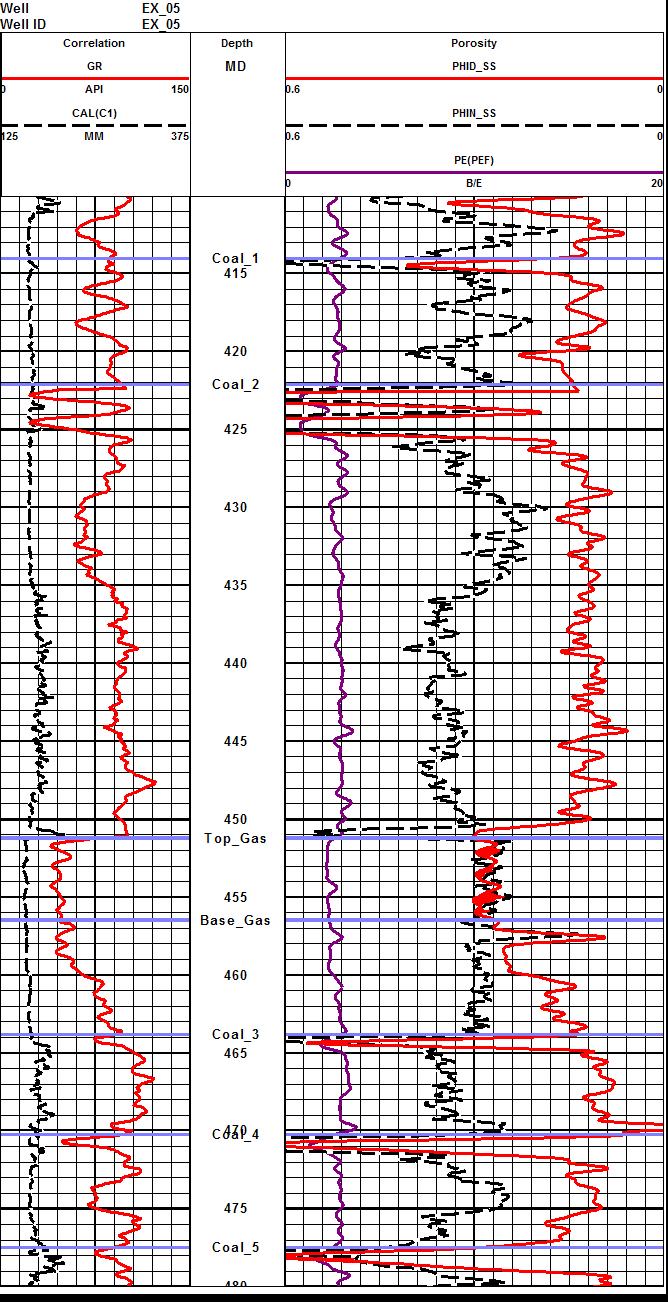
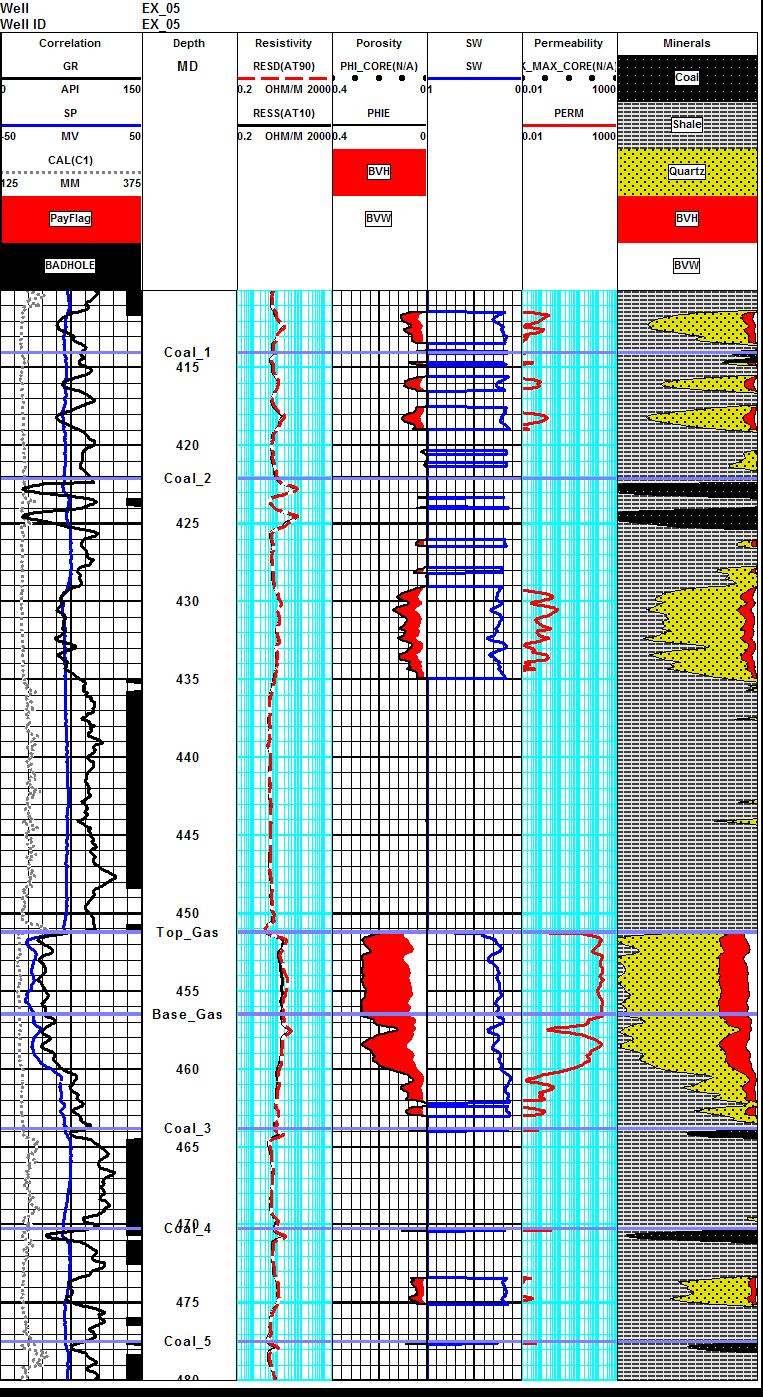
 Above the obvious sand, there
			is a shaly sand section. This interval
			is typical of many so-called "shallow gas sands". In fact,
			there are more than 40 shaly sands in this well, all of them
			potentially gas bearing. The moderate GR and moderate resistivity at
			this depth indicate gas. The SP has a very slight deflection, so
			this zone is not easy to find on ancient logs when there is no GR
			log. The trick is to segregate the
			coals, which may be coal bed methane prospects, and fresh water
			sands, which are easily mistaken for gas sands. Coal is easily detected by
			the high density porosity, high neutron porosity, and high
			resistivity values, and should be given zero effective porosity and
			coloured black on the answer plot.  Fresh water sands are
			difficult to distinguish in shaly rocks.  Gas bearing
			"fairways" are found by trial and error (testing and production).
			Integration with hydrodynamics is a useful approach to help define
			fairway boundaries.
 
			 SP (Track 1) and linear scale
			resistivity log (Track 2) displayed on a compute rplot to simulate
			an ancient ES log. Gamma ray log, shown in Track 3 might come from a
			cased hole correlation log or from an ancient gama ray neutron (GRN)
			log. Many shallow gas plays are developed frm ancient logs. The good
			SP and the 20+ ohm-m resistivity is a good shallow gas prospect. The
			shaly sand is harder to see as there is little SP development but
			higher than average resistivity. The shaly sand is much more obvious
			on the GR display. Coal beds need to be identified (no SP, high
			resistivity compared to gas sand).
 
 
  Here is the same resistivity log displayed on a logarithmic grid.
			The gamma ray is on the density neutron log shown below.
 
 
  On a mpdern well, the clean gas zone is obvious because of its high resistivity and
			density neutron crossover. The shalier sands above the obvious sand are less clear -
			but local experience says "GAS". Coal beds are easy to see
			on the density and neutron log curves.


  The "Base of Gas" is the base of
			gas crossover, but it is obvious that there is gas below
			this point. There are 400 meters above and 400 meters below this
			interval that have more zones of interest.
 
 |