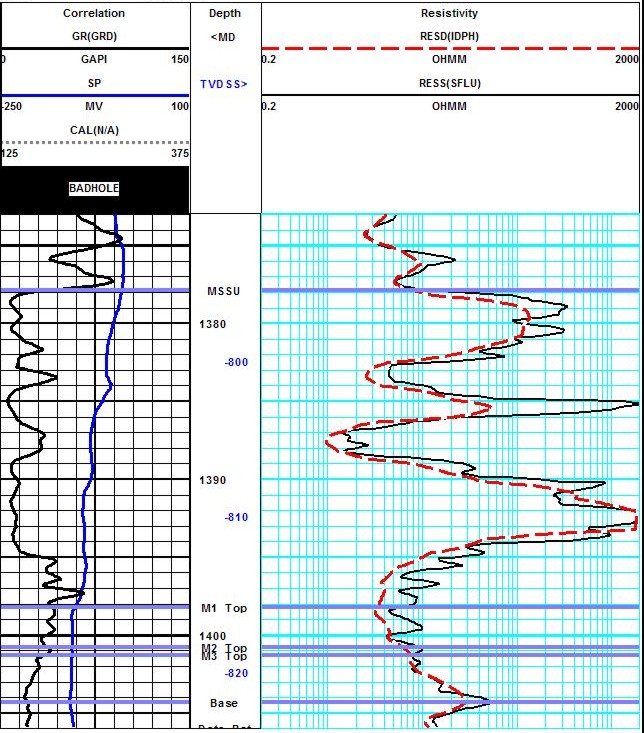
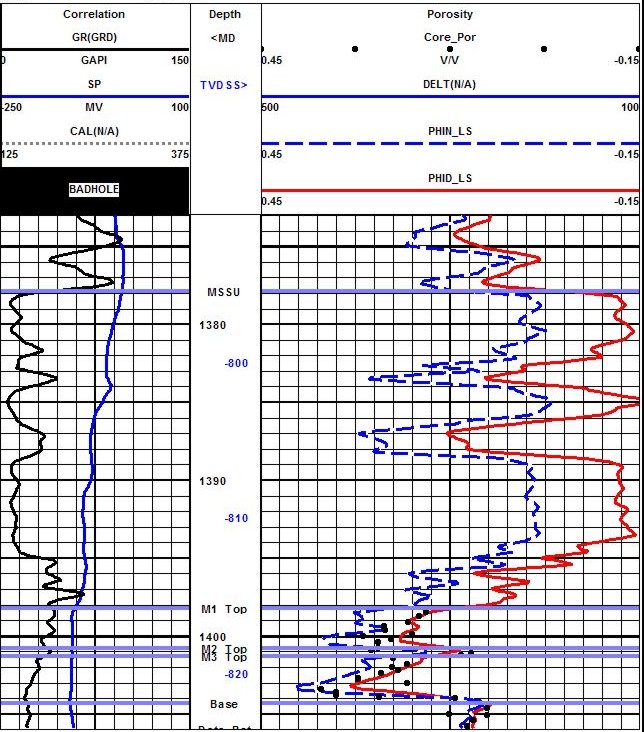
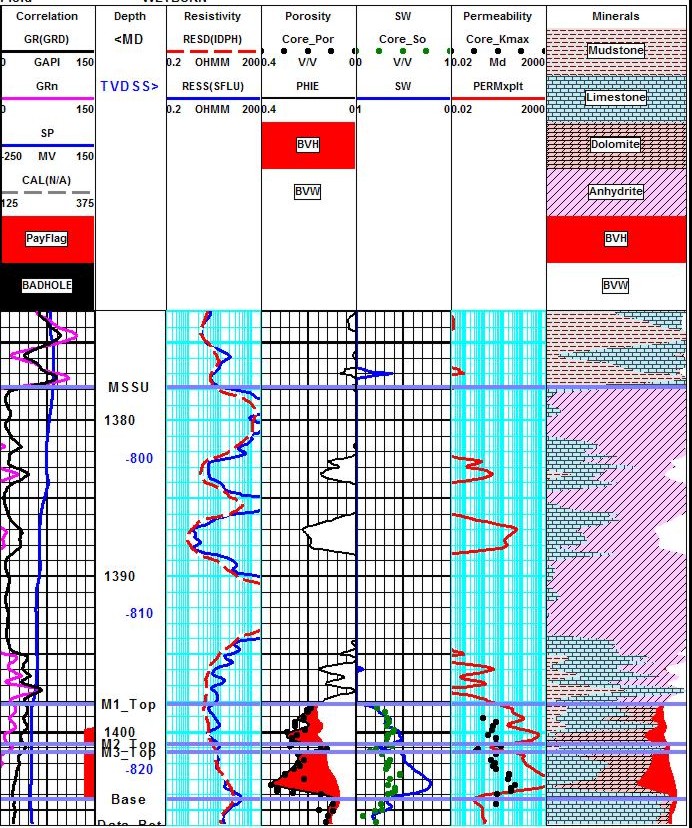
Finally, the pore geometry can vary dramatically from one level to the next, causing changes in irreducible water saturation and permeability Electrical properties are seldom constant. Fractures may influence the apparent saturation numbers, requiring some extra effort. And oil companies are getting lazy - we don't collect enough data to solve some of these problems, assuming that the data in ancient well files can be found and will answer all questions reliably. This just doesn't happen in real life. Try to find a particular special core analysis or the sample description record from 50 years ago. Lab work is better today. Geological concepts have changed. Conventional wisdom of the 1950's and 60's has moved on. So we need new data to improve accuracy in our analysis. This example does not have any new data except the logs and a sad well test. All parameters are based on "world-average" numbers tuned to the area by years of experience. The lithology consists of layers of anhydrite, dolomite, and some limestone. Porosity is moderate to zero. Although thin, some low porosity layers act as traps within the overall reservoir, just as they do in the Arab D and other carbonates in the Middle East. The reservoir has been in production since 1954 but new wells continue to find pockets of porosity at initial reservoir pressure. What does that tell you about reservoir continuity? You are bound to find depleted zones as well. This example has both, separated by an almost invisible tight streak. The upper oil layer is depleted and tested water. The lower zone is at irreducible water saturation and would probably produce clean oil if good isolation between it and the upper zone could be maintained. Since the oil lies under a wetter zone, there appears to be no fracture connecting them, although natural fractures are known in the area. Full size logs are shown below. See what you can see about the M1 and M3 zones before you look at the answer plot.
|
|
||
|
Page Views ---- Since 01 Jan 2015
Copyright 2023 by Accessible Petrophysics Ltd. CPH Logo, "CPH", "CPH Gold Member", "CPH Platinum Member", "Crain's Rules", "Meta/Log", "Computer-Ready-Math", "Petro/Fusion Scripts" are Trademarks of the Author |
|||

|
||
| Site Navigation | CASE HISTORY CARBONATE DEPLETED and BYPASSED OIL | Quick Links |