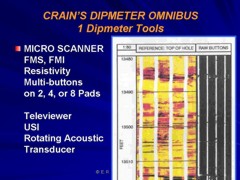
This example is from the Bach Ho (White Tiger) Field in Viet Nam. Log analysis in these reservoirs requires good geological input as to mineralogy, oil or gas shows, and porosity. A good coring and sample description program is essential, and production tests are essential. The analyst often has to separate ineffective (disconnected vugs) from effective porosity and account for fracture porosity and permeability. All the usual mineral identification crossplots are useful but the mineral mix may be very different than normal reservoirs. Many such reservoirs seem to have no water zone and most have unusual electrical properties (A, M, N), so capillary pressure data is usually needed to calibrate water saturation.
In the example below, the mineral assemblage was defined by the ternary diagram at right. The three minerals (quartz, feldspar, and plagioclase) were computed from a modified Mlith vs Nlith model, in which PE was substituted for PHIN in the Nlith equation. If data fell too far outside the triangle, mica was exchanged for the quartz. Three rock types, granite, diorite, and monzonite, were derived from the three minerals. A trigger was set to detect basalt intrusions. A sample crossplot shows how the lithology model effectively separates the minerals.
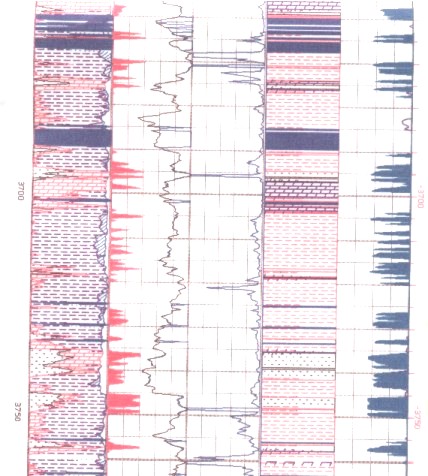
A sample of the log analysis plot is shown below. The average porosity from core and logs is only 0.018 (1.8%) and matrix permeability is only 0.05 md. However, solution porosity related to fractures can reach 17% and permeability can easily reach higher than several Darcies. Customized formulae were devised to estimate these properties from logs, based on core and test data. My colleague Bill Clow devised most of the methods used on this project.
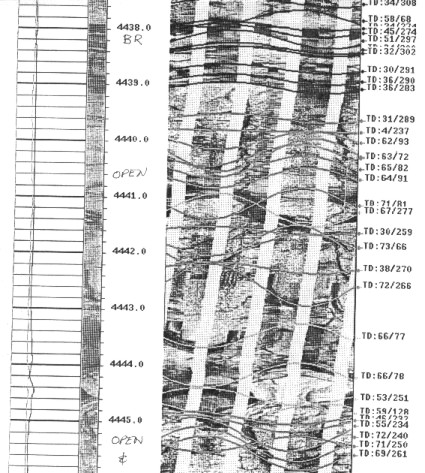
Note the fracture porosity and permeability derived from open hole log data. Fracture porosity from resistivity micro scanner logs was also computed where available to help control the open hole work. A black and white resistivity image log shows some of the fractures. Both high and low angle fractures co-exist.
It is clear that non-conventional reservoirs may need some extra effort, customized models, and unique presentations. Everything you need to develop these techniques can be found elsewhere in this Handbook. The mineral properties need to be chosen carefully, but the mathematical models don't change too much.
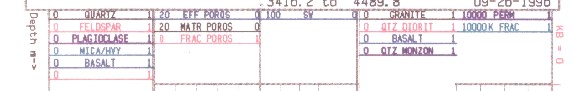
Quantitative
sample description of mineral composition is shown in track five
(right-hand track). Interpreted lithology is in track four; computed
porosity in track three (middle track). The log analysis porosity
matches core reasonably well (center track) and open hole fracture
indicators (right edge of track one) correspond to resistivity
image log data (left edge of track two). |
|
||
|
Page Views ---- Since 01 Jan 2015
Copyright 2023 by Accessible Petrophysics Ltd. CPH Logo, "CPH", "CPH Gold Member", "CPH Platinum Member", "Crain's Rules", "Meta/Log", "Computer-Ready-Math", "Petro/Fusion Scripts" are Trademarks of the Author |
|||

|
||
| Site Navigation | CASE HISTORY GRANITE RESERVOIR WHITE TIGER FIELD VIET NAM | Quick Links |