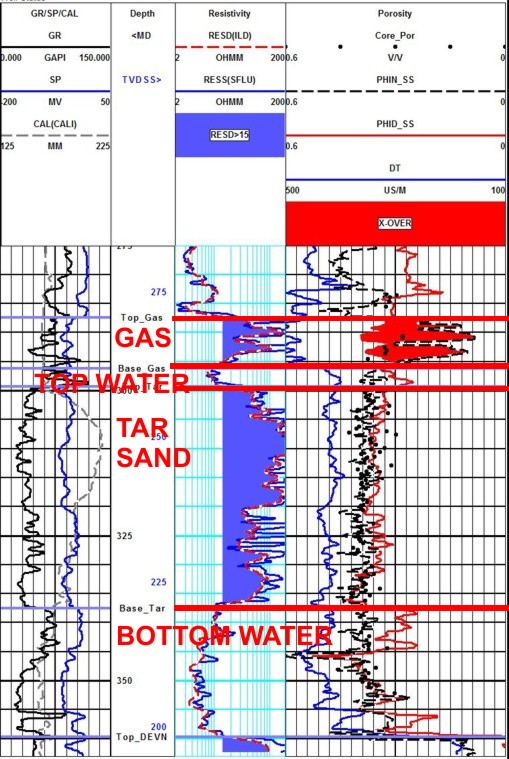
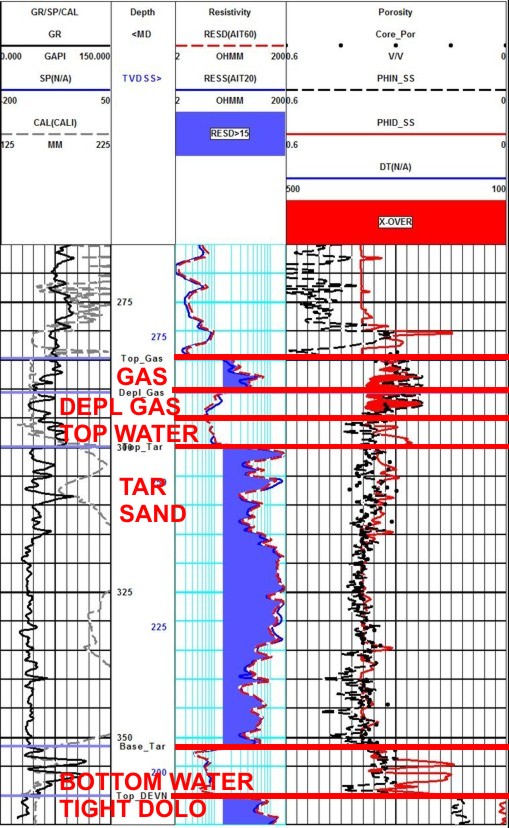
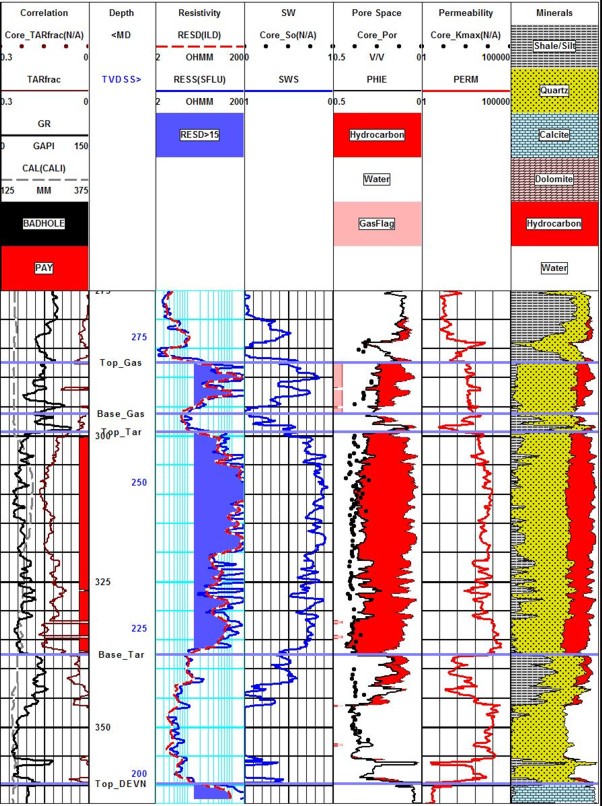
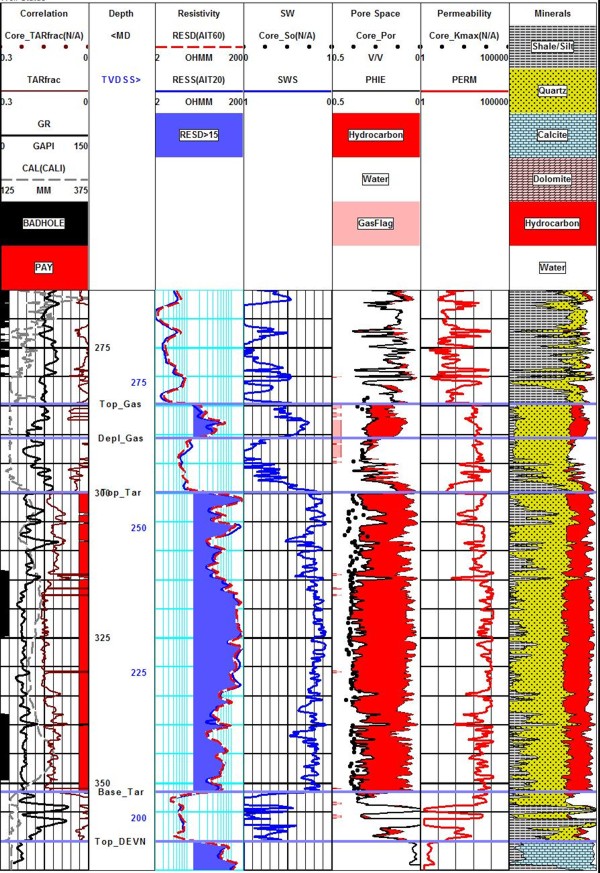
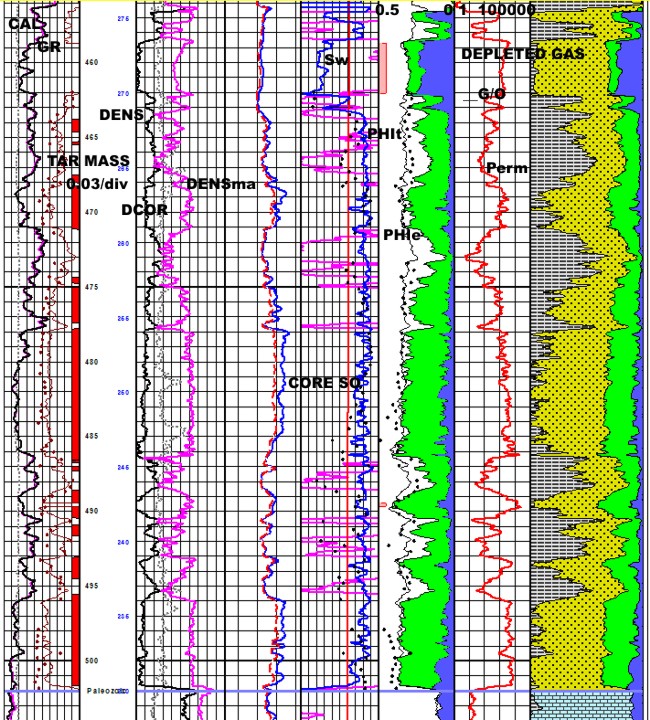
Shale breaks and thick low grade oil are unattractive targets for mining or in-situ production. In the example below, two wells are shown that are less than 100 meters apart. In the oil zone, the individual shale lenses are not correlatable over even this short distance. They act as baffles to the flow of steam upward and to the flow of oil downward to the collector wells. This example shows wells with reasonable quality reservoir characteristics. More shale on average is less attractive; less shale would be better. Note that these logs are on a highly compressed vertical scale, making them harder to see than other examples in this Handbook. The gas zone above the oil sand is also interesting. In the well on the left below, the gas crossover is clearly visible, shaded red, on the density neutron logs. The resistivity, shaded blue, is relatively high, even though the zone is somewhat shaly on the gamma ray. Contrast this with the well on the right, drilled 5 years later, but less than 100 meters away. There is still crossover on the entire gas interval, but the high resistivity covers only the top half of the zone. The lower half of the gas zone now has low resistivity - it is wetter than before, indicating that some of the gas has gone. Production from other wells has partially depleted this reservoir. Crossover still exists in the depleted zone because of residual gas. In fact, residual gas in a depleted zone is about the same as residual gas in an invaded zone, so unless recovery factor is extremely high, depleted gas zones will have some crossover, if they are clean enough to show crossover at all. The water between the gas and oil is called "top water" by the oil explorationist, to distinguish it from the "bottom water" below the oil. Either or both of the gas and top water zones may be missing in this region. The moral of the tale is that gas crossover can be misleading. First, prove it is gas and not bad hole condition or sandstone on a limestone scale. Second, check that the zone is resistive enough to still have a reasonably attractive water saturation. Then test the zone to be sure.
|
|
||
|
Page Views ---- Since 01 Jan 2015
Copyright 2023 by Accessible Petrophysics Ltd. CPH Logo, "CPH", "CPH Gold Member", "CPH Platinum Member", "Crain's Rules", "Meta/Log", "Computer-Ready-Math", "Petro/Fusion Scripts" are Trademarks of the Author |
|||

|
||
| Site Navigation | CASE HISTORY BITUMEN OIL SAND DEPLETED GAS ABOVE | Quick Links |