|
 FINDING FORMATION DIP FROM IMAGE LOGS
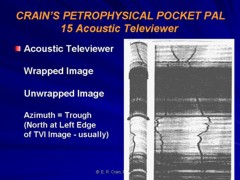
Resistivity and acoustic image logs display an
unwrapped view of a cylindrical image of the borehole wall,
scaled in colour to represent the resistivity or acoustic
impedance of the rocks. Bedding-planes of planar dipping
beds form sine wave shapes across the image, as shown in the
two image logs below.
Manual calculation of dip angle and down-dip direction (dip
azimuth) can be made by careful observation of the log and a
simple calculation:
1: DIP_ANGLE = ArcTan (H / D)
2. DIP_AZIM = direction of the deepest point on the sinewave,
referred to
direction scale at top of log
Where:
D = borehole diameter (inches or mm)
H = peak to peak amplitude of the sine wave (same inits as borehole
diameter)
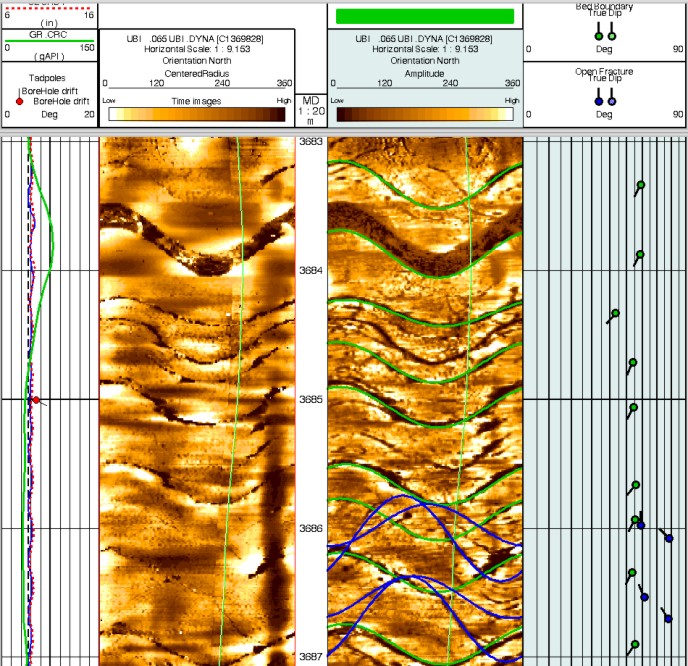
Ultrasonic (acoustic) image log;
travel time image (left) indicates borehole diameter, amplitude
image (right) shows acoustic impedance, dips calculated from image
show both bedding (green) and fracture (blue) dips. Direction scale
shows 0 degrees (North) at left edge of image -- some logs have
North in the middle of the log track. On this log, the deepest
points on many sine waves are near the middle of the track, so dip
azimuth is near South (180 degrees).
|