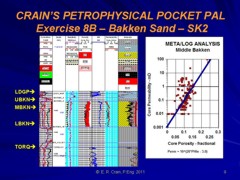
The usual approach to calibrating permeability is to crossplot core porosity versus permeability and obtain a regression line. Unfortunately this presumes that the rock type does not change over the interval. But the technique is widely used anyway. The porosity - irreducible water saturation (Wyllie-Rose) equation offers some improvement when pore geometry varies, but regression is more difficult due to the multiple variables.
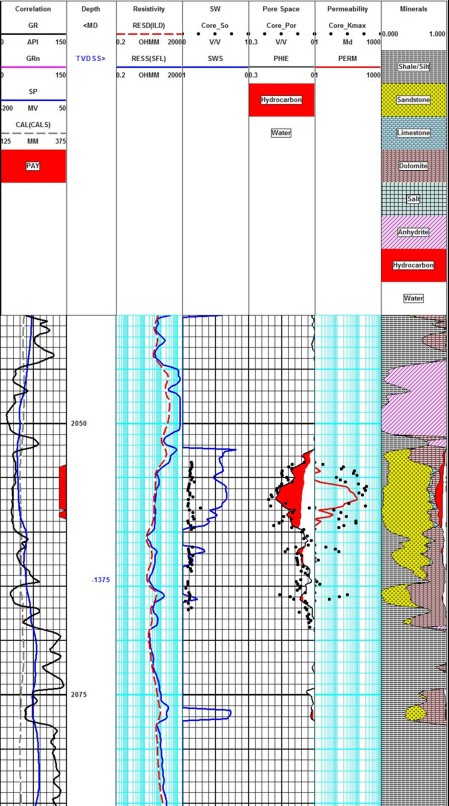
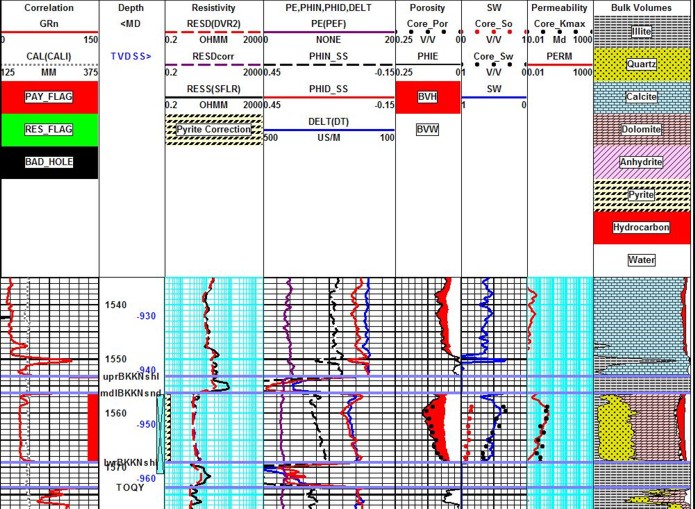
If there is more than one rock type in the interval, several trend lines may be evident. If data is a large splash on the plot, try to reduce scatter by zoning rock types. In fractured reservoirs, some data points with high perm and low porosity should be excluded from the curve fitting so that a matrix permeability is obtained separately from fracture permeability. A good feel for the quality or usefulness of log analysis permeability can be obtained by crossplotting predicted productivity with actual initial productivity. Average the third to ninth month production to get a realistic initial production value. Calibrating to this data will compensate for completion hardware, stimulation, fluid type, and reservoir conditions that could not be handled with our simplified math. This is not a very reliable approach, especially in fractured reservoirs, but it is better than not checking. Drill stem test flow rates, AOF, and IPR data can also be used. Be careful to compare log analysis results from only the tested interval. The best calibration tool is feedback from a reservoir simulation. If a history match can be obtained based on the reservoir description, all is well. If reservoir volume has to be augmented or permeability doubled to get a match, then the log analysis or the reservoir maps need help. Frank and intelligent discussion between all disciplines in the analysis team will usually find where calibration is still needed.
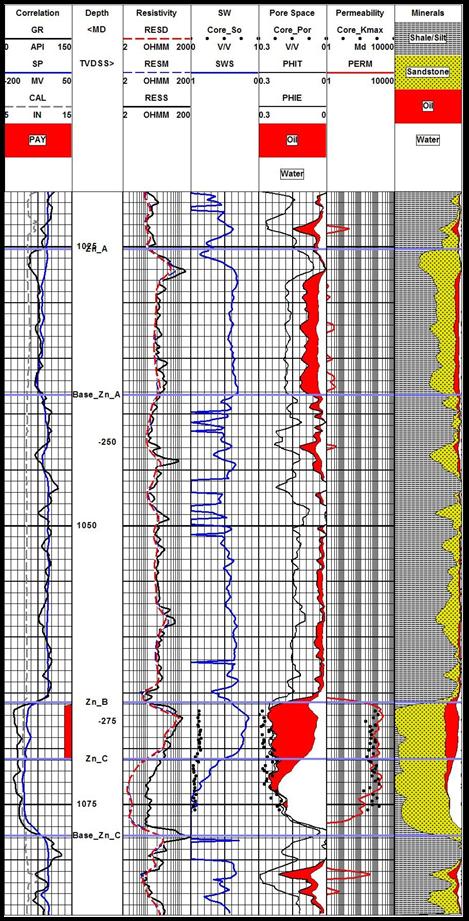
ines are log analysis.
|
|
||
|
Page Views ---- Since 01 Jan 2015
Copyright 2023 by Accessible Petrophysics Ltd. CPH Logo, "CPH", "CPH Gold Member", "CPH Platinum Member", "Crain's Rules", "Meta/Log", "Computer-Ready-Math", "Petro/Fusion Scripts" are Trademarks of the Author |
|||

|
||
| Site Navigation | PERMEABILITY CALIBRATION TO GROUND TRUTH | Quick Links |