|
 CONVERTING ELEMENTS TO MINERALS
Induced gamma ray spectroscopy logs
come in many flavours: geochemical log, elemental
spectroscopy log, and many other descriptive trade names.
They are logs of elemental
concentrations from which the mineral composition of the formation may
be derived.
The words "geochemical log" as used here should not be confused
with the same term used to describe laboratory procedures to
determine quite different
chemical properties of rocks.
Absolute mineral concentrations can be
derived by using the
oxide-closure model, which that
defines what minerals are present. The first complete
geochemical logs were run in the mid 1980s - the number of
chemical elements that can be isolated has grown
considerably since then.
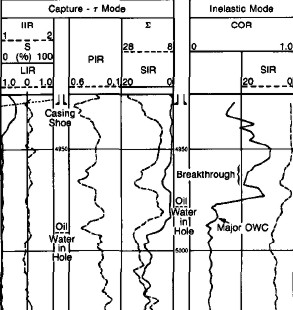 The
oxide-closure model for converting relative elemental yields from a
pulsed neutron spectroscopy log to absolute weight concentrations
uses the assumption that the sum of all oxides in the rock matrix is
1.00. The model is based on the observation that, with few
exceptions, sedimentary minerals are oxides, so that the sum of the
dry weight percent of all oxides must be 100%. The weight percent of
an oxide can be calculated from the dry weight percent of the cation
by knowing the chemical formula. The
oxide-closure model for converting relative elemental yields from a
pulsed neutron spectroscopy log to absolute weight concentrations
uses the assumption that the sum of all oxides in the rock matrix is
1.00. The model is based on the observation that, with few
exceptions, sedimentary minerals are oxides, so that the sum of the
dry weight percent of all oxides must be 100%. The weight percent of
an oxide can be calculated from the dry weight percent of the cation
by knowing the chemical formula.
Example of element yields from an induced GR spectroscopy log ==>
The absolute dry
weight fraction, W, of element i is given by:
1: Wi = F * Yi / Si
Where:
F = unknown normalization factor
Yi = measured spectral gamma ray yield
Si = tool sensitivity to that element, measured in the laboratory.
The dry weight
fraction of the oxide is then:
2:Oi = F * Xi * Yi / Si
Where:
Oi = the oxide association factor, given by the chemical formula.
Since the sum of all Oi equals 1.00, it is possible to calculate F
and determine each Wi .
The first step involves spectral
deconvolution of the composite gamma ray energy spectrum by
using a set of elemental standards to produce relative elemental
yields. The relative yields are then converted to dry-weight
elemental concentration logs for the elements.
For the ECS, the element list is Si, Fe, Ca, S, Ti, and Gd
using the oxides closure method. Matrix properties and
quantitative dry-weight lithologies are then calculated from the
dry-weight elemental fractions using empirical
relationships derived from an extensive core chemistry and
mineralogy database.
The final display includes total clay, total carbonate, anhydrite + gypsum,
from, QFM (quartz + feldspar + mica),
pyrite, siderite, coal, and salt. Matrix properties, such as matrix grain density, matrix thermal and epithermal neutron,
and matrix sigma are also presented - helpful parameters for
calculating porosity from other logs.
The LithoScamer uses inelastic and capture spectroscopy to detect
21 elemental yields including: Al, Ba, Br, C, Ca, Cl, Cu, Fe, Gd, H, K, Mg, Mn, Na, Ni,
O, P, S, Si, Sr, Ti
These can be resolved into total organic carbon (TOC),
anhydrite, clay, calcite, coal, dolomite,
evaporite, pyrite, QFM, siderite. The metals copper, iron, magnesium,
nickel, and aluminum can be identified in hard rock scenarios.
The Pulsar or advanced pulsed neutron log gives
the results as shown above and adds a new measurement, the fast
neutron cross section (FNXS). This
curve easily differentiates gas
from oil and water.
This advanced tool is ideal for cased hole formation evaluation,
especially in CO2, H2, and CH4 storage projects.
 EXAMPLE LOGS
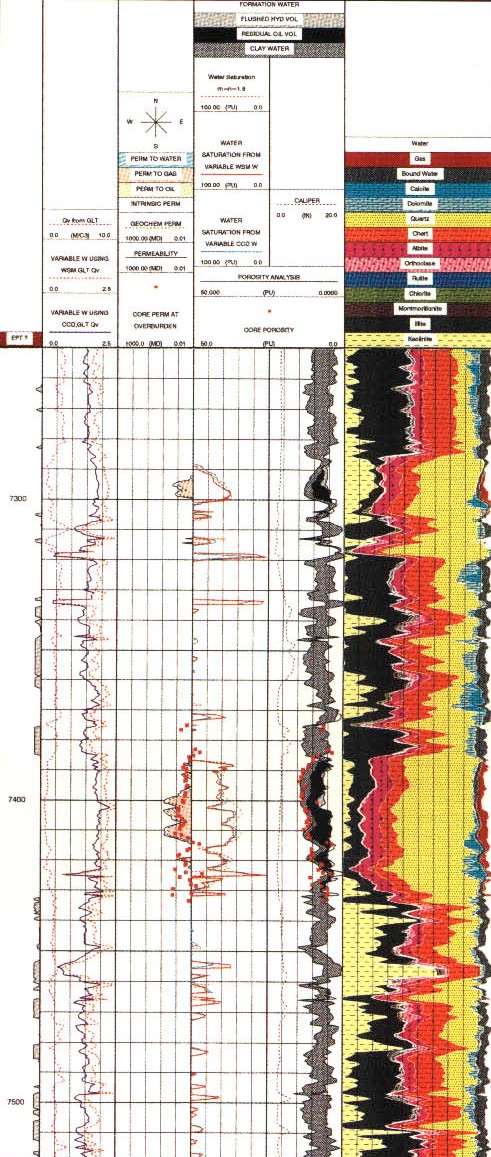
Computed lithology from oxide model, including porosity and
hydrocarbon saturation from C/O ratio.
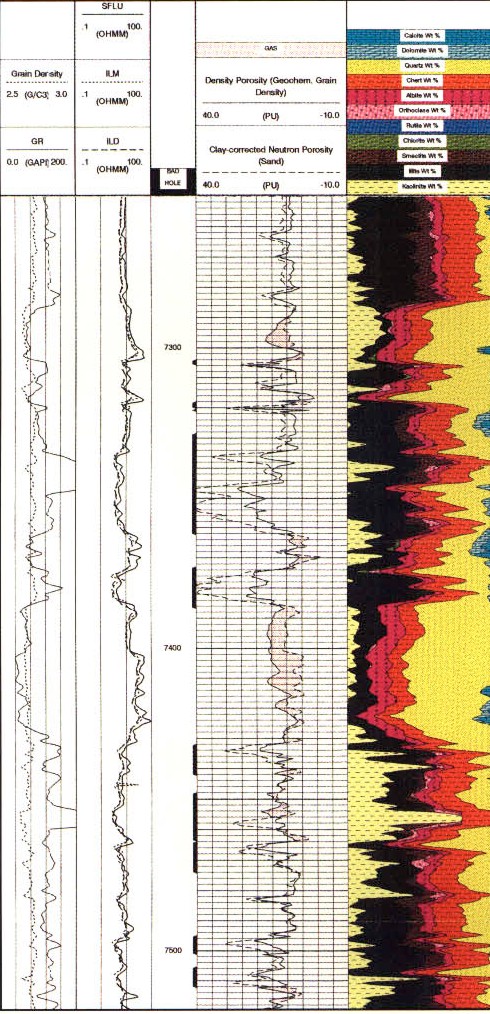
Alternate analysis for lithology and chromostratigraphy.
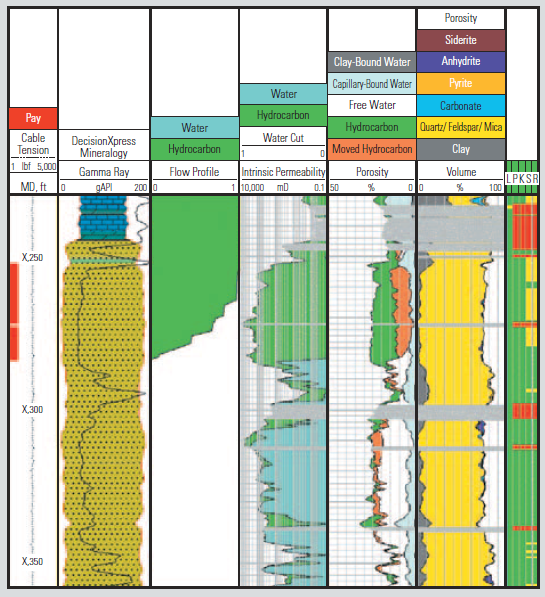
ECS Log showing volume track with mineral concentrations.

LithoScanner mineralogy showing increased elemental precision:
carbonates separated into calcite and dolomite; chlorite from
total clay.
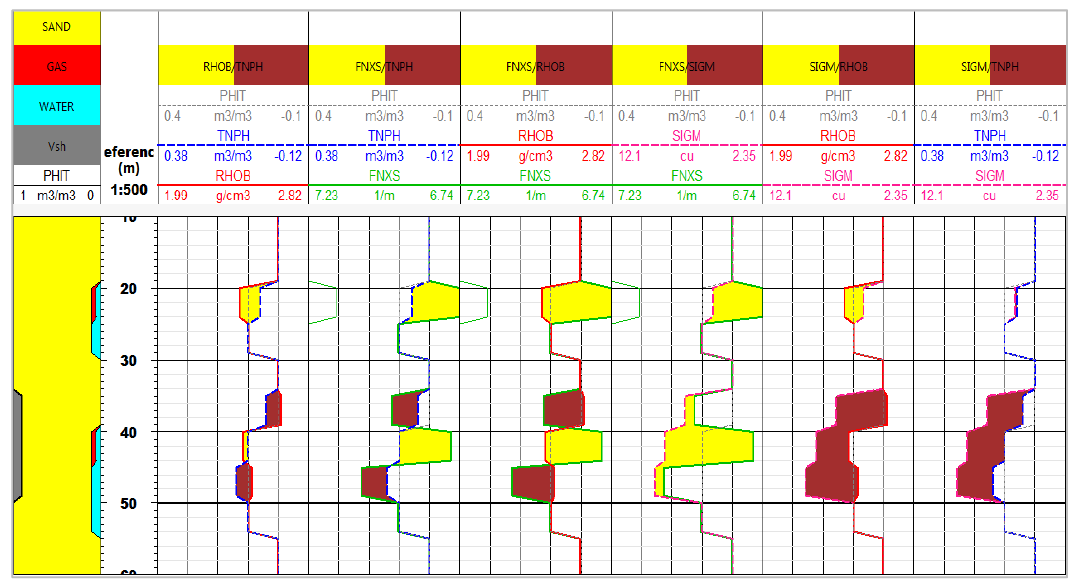
Pulsar Log: simulated log response modeled in sand/shale
sequence, comparing RHOB/TPHI with FNXS/TPHI overlays,
|


 The
oxide-closure model for converting relative elemental yields from a
pulsed neutron spectroscopy log to absolute weight concentrations
uses the assumption that the sum of all oxides in the rock matrix is
1.00. The model is based on the observation that, with few
exceptions, sedimentary minerals are oxides, so that the sum of the
dry weight percent of all oxides must be 100%. The weight percent of
an oxide can be calculated from the dry weight percent of the cation
by knowing the chemical formula.
