|
 Deciding
What The Patterns Mean
Deciding
What The Patterns Mean
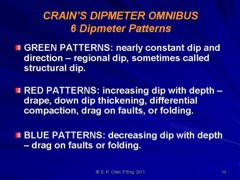
There are two basic ways to decide what red and blue patterns
mean from a structural point of view. The first is to sketch a
cross sectional view of the well bore with the bedding planes
positioned according to the dipmeter data. These can be made by
hand or with stick diagram software.
The
second is to use a catalog or cook book of typical patterns to
compare your pattern with those already described. As mentioned
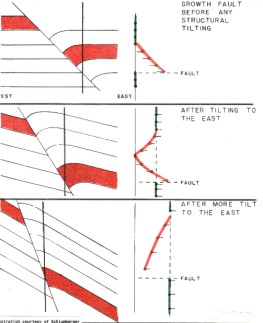
earlier, regional dip removal can change a pattern, so the cook
book approach is not too useful unless dip removal has been done.
Also, the cook book patterns presume that dip directions shown
on logs are always parallel to your cross section direction. This
is not always true so it becomes necessary to rotate dips to get
the "best" patterns. Both transverse and longitudinal
cross sections should be visualized when analyzing dip patterns.
Before
you start sketching patterns, review the basic structural features
described earlier in this Chapter. Then draw a sketch of the dipmeter
data. Take a piece of graph paper or blank well log paper and
draw a vertical line to represent the wellbore. A log print with
gamma ray, SP, and resistivity is also a good place to draw your
diagram.
Select
the interval you wish to analyze and mark some depth lines to
orient your data. For structural analysis, a compressed scale
of 1 or 2 inches to 100 feet or smaller is appropriate. Transfer
the position of the black patterns to your sketch. These represent
breaks in the geologic sequence, such as unconformities or tops
and bottoms of sedimentary structures. Use the gamma ray curve
or a computed lithology log and the well history data as guides
to major erosional surfaces.
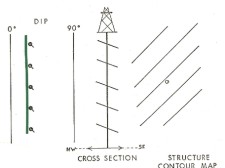 Stick plot of regional dip Stick plot of regional dip

Next,
choose regional dip in each major rock unit. At this point you
have to decide on the direction of cross section that your sketch
will represent. Usually, for structural analysis, it is chosen
to be the regional dip direction, although another sketch drawn
at right angles to the first may be useful in many cases.
For
example, if regional dip is to the south east, the cross section
should run from north west to south east. Draw short hash marks
on the well bore at an angle representing the actual dip shown
on the log. Some vertical exaggeration may be appropriate. An
example of this simple case is shown above.
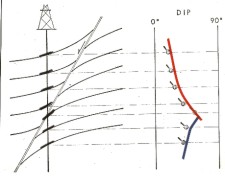  Stick diagram for a normal fault with drag Stick diagram for a normal fault with drag
Next,
position representative samples of the dip from the blue and red
patterns onto your sketch. You are really creating your own stick
plot. It may be helpful to include a sketch of the dipmeter log
itself on the same piece of paper. If
the red and blue patterns are contained within a sand body, they
are stratigraphic dips and should not be used in a structural
interpretation.
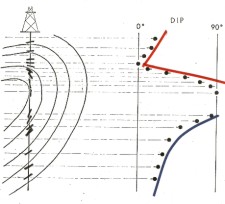
Stick diagram for an overturned anticline
Now
comes the hard part. Extend the hash marks to represent the bedding
planes of a structure. Basically you are only dealing with regional
dip, anticlines, synclines, unconformities, and faults. To propose
a fault, there should be some evidence from the well history,
some scattered dips at the break between the red and blue patterns,
a change in direction of dip, some missing or repeated section,
or drag and rollover features. The red pattern is usually connected
to the green pattern above it.
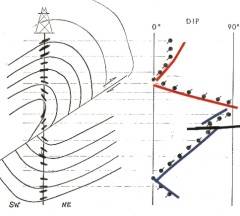 Stick diagram for overthrust fault Stick diagram for overthrust fault
Reverse
faults and overturned anticlines can have similar patterns - the
anticline is distinguished by dips approaching 90 degrees, whereas reverse faults seldom do this.
Overthrust faults will usually show an abrupt change in dip direction
near the fault plane
Normal
faults, overthrust faults, channels, unconformities, and disconformities
can have similar patterns - repeat section indicates the overthrust
case. The lithology and dips indicating crossbedding help distinguish
channels. Choose the model which suits the local geology the best.
Most patterns can be interpreted without imposing a fault and
the most common error in dipmeter analysis is the suggestion of
too many faults.
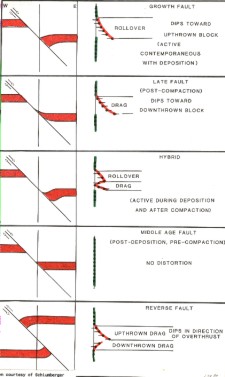 
Normal faults (left, reverse fault (left bottom),
growth faults (right)
Growth
faults, contemporaneous with deposition, usually show rollover,
which is a dip pointing toward the upthrown block.
Post-depositional faults usually show drag, which is a dip
pointing toward the downthrown block. Hybrid faults can exhibit
complex patterns. Some faults show no rollover or drag. Remember
the effect of regional dip on these patterns.
Drawing
your own stick diagram and interpreting a plausible geologic section
to match it takes practice, patience, and a good grasp of 3-D
space. A good knowledge of geology doesn't hurt. The effect of
hole deviation must also be considered. Although the dips presented
on the log are true dips, with hole deviation taken into account,
their position in space may not have been corrected for true vertical
depth or the track of the borehole.
|