Many other attempts during the 1930's through the 1960's demonstrated potential, but were not commercially successful. Measurement While Deilling (Mud Logging), discussed elsewhere in this Handbook, became possible in the 1950's and gained widespread use in the 1960's onward. Real commercial tools arrived in the 1970's, mostly for geosteering applications. In the 1980's, more variety of measurements, including GR, resistivity, and neutron became available. By the 1990's nearly every measurement that could bne made by wireline in open hple, could now be made while drilling. Aside from the real time measurements, LWD offers another significant advantage - there is very little drilling fluid invasion at the time of logging, so logs are less affected by this problem. Borehole conditions may also be better than is the case for wireline logging.
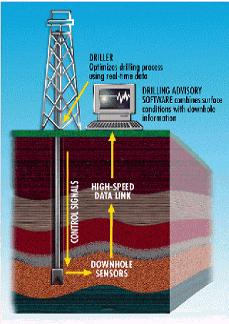
Measurement While Drilling (MWD) Is a term used to describe drilling related measurements made at the surface or made downhole and transmitted to the surface while drilling a well. The terms MWD and LWD are sometimes used interchangeably, but we like to think of LWD as the process of obtaining information about the rocks (porosity, resistivity, etc) and MWD as obtaining information about the progress of the drilling operation (rate of penetration, weight on bit, wellbore trajectory, etc). MWD today often refers to geosteering measurements made to help decide on changes to the wellbore path. The measured results are stored in LWD and MWD tools and some of the results can be transmitted digitally to surface using mud-pulse telemetry. Certain MWD systems have the capability of receiving encoded control commands which are sent by turning on and off mud pumps and/or changing the rotation speed of the drill pipe. These messages allow the drill bit to be steered in a desired direction LWD technology was developed originally as an enhancement to the earlier MWD technology to completely or partially replace wireline logging operation. With the improvement of the technology in the past decades, LWD is now widely used for drilling (including geosteering), formation evaluation, especially for high angle wells. In frontier areas, deep water offshore, and critical wells anywhere, the real time log data as the well is drilled may be critical to the success and economics of the well.
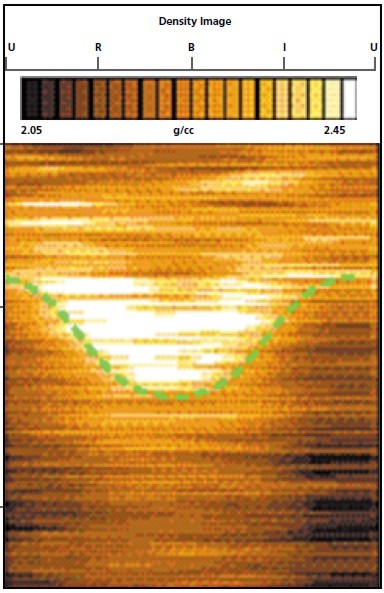
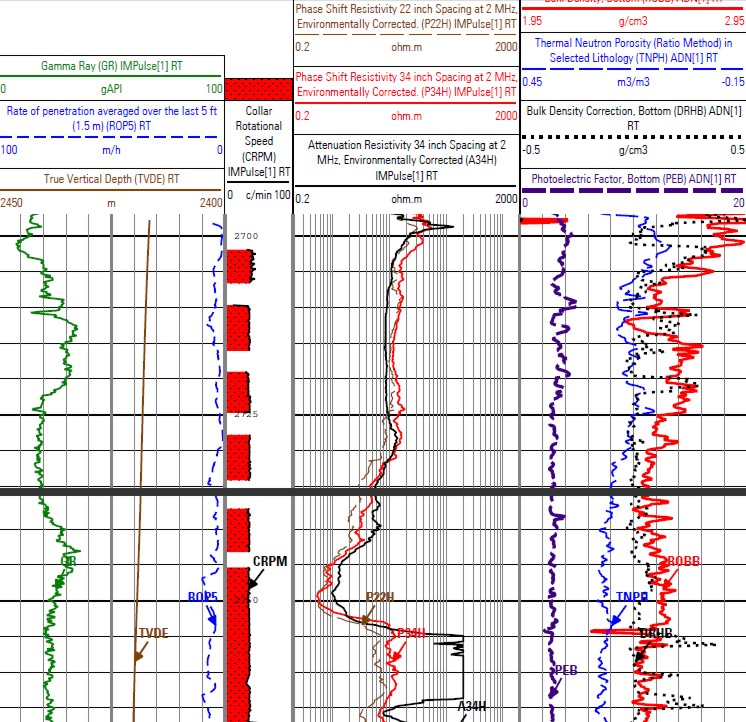
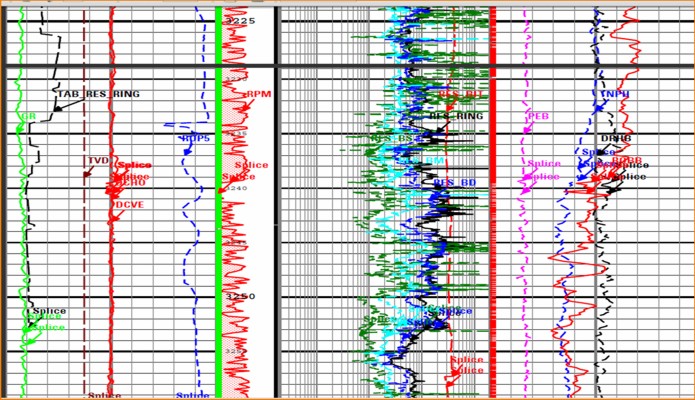
Over the years, a majority of the conventional wireline measurements have been made available in LWD. Certain new measurements are available only in LWD, for example density imaging logs. The following is a list of available measurement in LWD:
Natural gamma ray
|
|
||
|
Page Views ---- Since 01 Jan 2015
Copyright 2023 by Accessible Petrophysics Ltd. CPH Logo, "CPH", "CPH Gold Member", "CPH Platinum Member", "Crain's Rules", "Meta/Log", "Computer-Ready-Math", "Petro/Fusion Scripts" are Trademarks of the Author |
|||

|
||
| Site Navigation | LOGGING ACQUISITION OF LOGS WHILE DRILLING (LWD) | Quick Links |
 The
first patent for an LWD tool appeared in 1932, for a tool that was a
mimic of an ES log. Developed by J. C. Karcher , President opf
Geophysical Services Inc (GSI) at the time, it used an insulated rod
inside each drill pipe secion to conduct power and transmit the
resistivity measurement to the surface. The electrodes were on an
insulated mandrill above the but. It was not very reliable and not
widely used.
The
first patent for an LWD tool appeared in 1932, for a tool that was a
mimic of an ES log. Developed by J. C. Karcher , President opf
Geophysical Services Inc (GSI) at the time, it used an insulated rod
inside each drill pipe secion to conduct power and transmit the
resistivity measurement to the surface. The electrodes were on an
insulated mandrill above the but. It was not very reliable and not
widely used.