|
 Determining Fracture Orientation
As mentioned above, when formation pressure is isotropic (equal
in all directions), the tectonic stress is zero and Pfrx equals
Pfry. In this situation, the borehole is round and spalling of
the formation is either non-existent or equal in all directions.
In stressed regions, such as in the Rocky Mountains, the borehole
will erode to an oval shape. The minimum diameter shows the direction
of maximum stress and the maximum diameter shows the direction
of minimum stress..
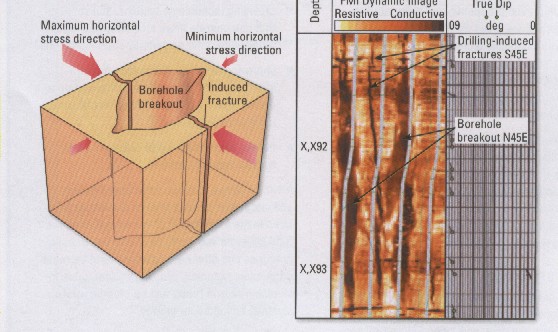
Borehole shape indicates stress direction –
maximum stress in direction of
minimum hole
diameter. Formation microscanner and dipmeters have
oriented caliper data.
Many
modern logs have an X and Y axis caliper, but not all of them
are oriented to true north. When directional data is recorded,
as with dipmeters and many modern resistivity tools, the X and
Y orientations are known, Statistical plots are helpful in choosing
the dominant direction).
Borehole diameter indicates stress direction -
this example is from India where the minimum
stress direction
is NE - SW.
 A
hydraulic fracture will usually penetrate the formation in a plane
normal to minimum stress, or parallel to the plane of maximum
stress. Any stress anisotropy (tectonic stress) will cause the
fracture to be other than vertical. A
hydraulic fracture will usually penetrate the formation in a plane
normal to minimum stress, or parallel to the plane of maximum
stress. Any stress anisotropy (tectonic stress) will cause the
fracture to be other than vertical.
Natural
fractures take the same directions as hydraulic fractures, indicated
again by the borehole shape. In addition, the high angle dips
seen on an open hole dipmeter or image log, will also indicate this preferential
direction. Since most hydraulic fracture jobs are run in casing,
it is not possible to run a dipmeter or caliper survey to find
the orientation of a hydraulic fracture. The preferential direction
can be predicted from previous open hole data. Dipmeter and caliper
data can be displayed on rose diagrams to illustrate preferential
directions.
If
an azimuthal gamma ray log existed, the fracture orientation could
be located by a tracer survey. I am not aware that such a tool
exists, but it would not be difficult to design one..
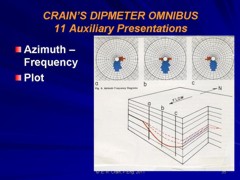
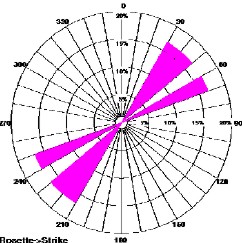
 Azimuth frequency (rose diagram) plots show direction of
dips seen on dipmeter and image logs. When steep dips caused by
fractures are isolated from lower angle bedding dips, the
direction of maximum stress xan be determined. In this case, the
direction is N30E. Azimuth frequency (rose diagram) plots show direction of
dips seen on dipmeter and image logs. When steep dips caused by
fractures are isolated from lower angle bedding dips, the
direction of maximum stress xan be determined. In this case, the
direction is N30E.
Stress
direction is not constant over geological time scales. Differences
in the direction of induced fractures (present day stress
direction), open fractures (some time ago), healed fractures (older
than open fractures), and small faults (could be any age) will help
to show the stress history of a region. An example log and rose
diagrams are shown below.
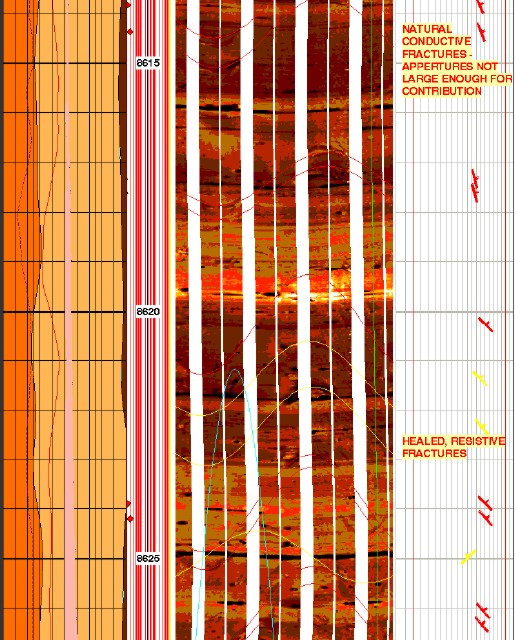
Image log in fractured reservoir: gamma ray (left track, shaded
red), image track (middle) with open fractures (red sine waves and
healed fractures (yellow sine waves), dip track (right) shows red
amd yellow dip angle and azimuth. There are no induced fractures in
this short interval. Bedding planes are near horizontal. Imagine
trying to locate these steep dips without the aid of a computer.
.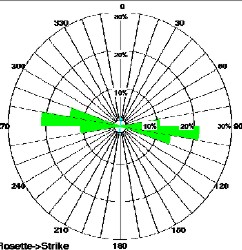
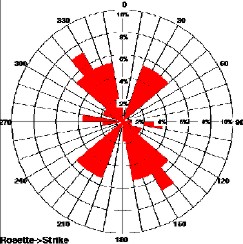
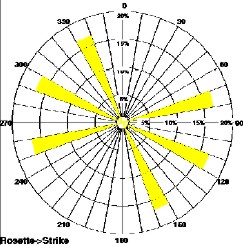
Induced fractures (top left) show current stress direction. Open
fractures (top right) show stress direction when fractures were
created, healed fractures (lower left) show different direction at
an earlier phase in geological time, and micro faults (lower right)
shows another stress regime was present when the faults occurred.
The
newest dipole shear sonic log is also an azimuthal tool with dipole
sources set at 90 degrees to each other. The example below shows the shear images for the X and Y directions. This
log can be run in open or cased hole.
Dipole shear image log shows directional stress
- the Fast Direction is centered on
90 degrees (east - west) which
is also the maximum stress direction.
Resistivity and acoustic image logs also provide assistance in locating fracture orientation before the well
is cased.
|