Petrophysical Training
Licenses
|
 FLUID IDENTIFICATION LOGGING BASICS
The flowmeter tells us how much fluid is
moving at any point in a production or injection well, but
it tells us nothing about which fluids are present or where
each came from. To resolve this, the logging industry has
come up with a number of solutions, described later on this
page.
Portions of this article are from the Schlumberger Glossary, with
minor edits and additions from other sources such as PetroWiki.
The term “holdup” appears often in fluid flow literature. It has
nothing to do with gun violence or the price of gasoline at the
service station. It really relates to the fraction of the total flow
contributed by each fluid phase, oil, gas, and water.
In multi-phase flow, “holdup” is the fraction of a particular fluid
present in an interval of pipe. Each fluid moves at a different
speed due to different gravitational forces (fluid density effect)
and other factors (viscosity
effect),
with the heavier phase moving slower, or being more “held up”, than
the lighter phase.
The sum of the fluid holdups of the fluids present is unity. The
“holdup ratio” is the ratio of the holdups of any two of the fluids.
For example, if the water holdup at a particular depth is 0.20, then
oil holdup is (1.00 – 0.20) = 0.80 and holdup ratio of oil to water
is 0.80 / 0.20 = 4.0.
The holdup of a particular fluid is not the same as the proportion
of the total flow rate due to that fluid, also known as its “cut”.
To determine in-situ flow rates, it is necessary to measure both
holdup and velocity of each fluid.
A “holdup” log is a record of the fractions of different fluids
present versus depth in the borehole. Various techniques are used to
measure these fractions. The earliest techniques measured the fluid
density, using a gradiomanometer, nuclear fluid density log, or the
dielectric properties as in the fluid capacitance log.
While these techniques were satisfactory in near-vertical wells with
two-phase flow, they were often found to be inadequate in highly
deviated and horizontal wells, where flow structures are complex.
More recent developments are based on the use of multiple local
probes (eg. array capacitance and array spinner imaging tools) to
detect bubbles of gas, oil, or water, and on a combination of
nuclear techniques usually known as three-phase holdup logs.
GRADIOMANOMETER
Introduced in the
late 1950s, the gradiomanometer measures the pressure difference
between two pressure sensors, placed approximately 2 feet (0.6 m)
apart. The pressure difference reflects the average fluid density
within that depth interval. The resolution is high, around 0.005
g/cc, but the accuracy can be affected by a friction effect, a
kinetic effect, and well deviation. The effect of deviation can be
corrected, but the sensitivity to holdup is reduced as the deviation
increases until it is zero in a horizontal well.
If we know or can estimate the density of the individual fluid
components (oil, gas, water), we can calculate the relative fraction
of each fluid present. This allows holdups to be determined,
directly in the case of two-phasic flow, and in combination with
other measurements for three-phasic flow.
The partitioning equation for a two-phase system is:
1: HoldUp1 = (DENS - DENS2) / (DENS1 - DENS2)
2: HoldUp2 = 1 - HoldUp1
Where:
HoldUp1 = fraction of fluid 1 at this depth
HoldUp2 = fraction of fluid 2 at this depth
DENS = density of fluid mixture (g/cc or kg/m3)
DENS1 = density of fluid 1 (g/cc or kg/m3)
DENS2 = density of fluid 2 (g/cc or kg/m3)
With the well shut in and if there is a sump below the perfs, it
often contains formation water so water density can be measured
directly by the log. Some distance above this, a direct measurement
of oil density can be made. Then during stable production, the
complete log for water holdup can be run.
Numerical Example
Assume
DENS1 = downhole water density = 1.110 g/cc
DENS2 = downhole oil density = 0.710 g/cc
Composite fluid density = 0.810 g/cc
Water Holdup = (0.810 - 0.710)/(1.110 - 0.710) = 0.100 / 0.400 =
0.25 (or 25%)
Oil Holdup = (1.0 - 0.25) = 0.75 (or 75%)
FLUID CAPACITANCE LOGS
This log
provides a record of the capability of the fluid passing through a
sensor to store electrical charge. Since water has a high dielectric
constant, and hence capacitance, the log can distinguish water from
oil or gas. The fluid capacitance log can therefore identify water
and be scaled in terms of water holdup. However the relation between
capacitance and holdup depends strongly on whether the water is the
continuous phase, complicating quantitative evaluation.
The log was introduced in the 1960s as the so-called holdup meter.
It was mainly used in three-phase flow, or when fluid-density
measurements were insufficiently sensitive to water at low holdup,
or with heavy oils. Since the late 1980s, other holdup measurements
have been preferred.
NUCLEAR FLUID DENSITY LOG
Tool names used by the many service providers are
confusing or misleading. Focused gamma ray and unfocused gamma ray
logs, for example, do not record a gamma ray log, but they do use a
chemical gamma ray source to create a simple uncompensated density
log with a very small range of investigation.
These logs measure the density of fluids in a completed well, using
a radioactive source of gamma rays and a detector. A cesium 137 or
americium 241 source is used to induce Compton scattering, as in the
openhole density log, except that the device is unfocused. The count
rate at the detector depends primarily on the density of the fluids
in the well.
In unfocused devices, the source and detector are situated so that
the gamma rays pass outside the tool. The results reflect an average
density of all the fluids within the well at that depth. In smaller
casings, some formation signal may contaminate the measurement. This
type of density log has been used to assess the quality of gravel
pack completions.
On some devices, the fluids pass through an open space in the body
of the tool within which the measurement is made. The results
reflect the density of the fluids passing through the tool. Some
people call this type of tool a focused fluid density log since the
gamma rays are focused on the wellbore fluid and are not influenced
by anything outside the tool body.
Most fluid density logs are scaled in density units (g/cc) but some
may have a counts per second (cps) scale. Holdup is calculated as
explained for the gradiomanometer,
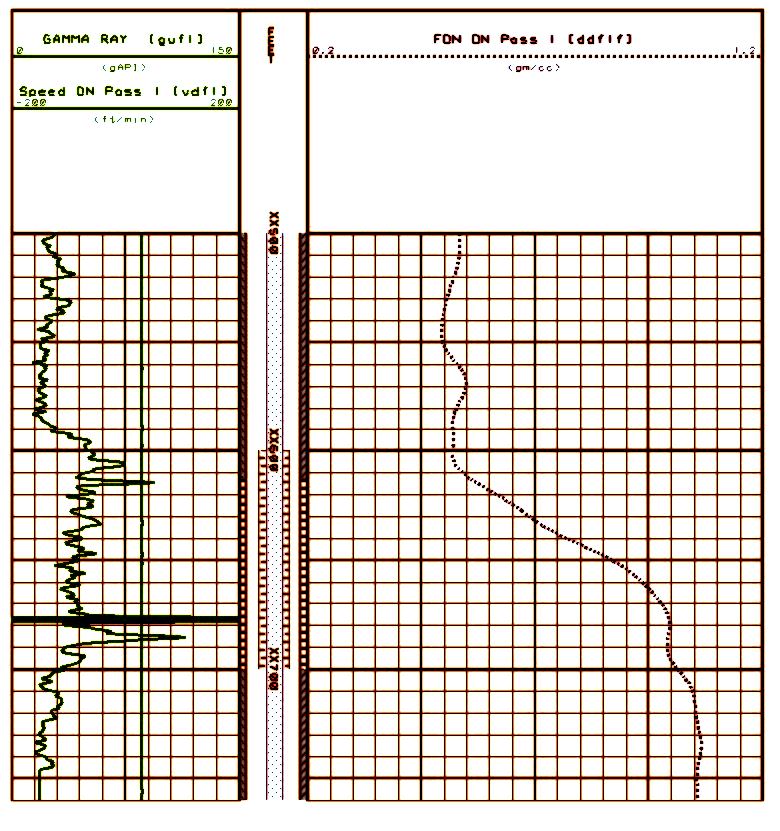
Example of a fluid density log using a chemical gamma ray source.
Density scale is 0.6 to 1.1 g/cc. Both water and oil densities can
be read directly from the log. A natural gamma ray log is in Track1
for correlation.
Compared with a gradiomanometer, the nuclear fluid density log is a
less direct measurement of density, and has a statistical
uncertainty and less resolution, but it is not affected by well
deviation, friction, or kinetic effects.
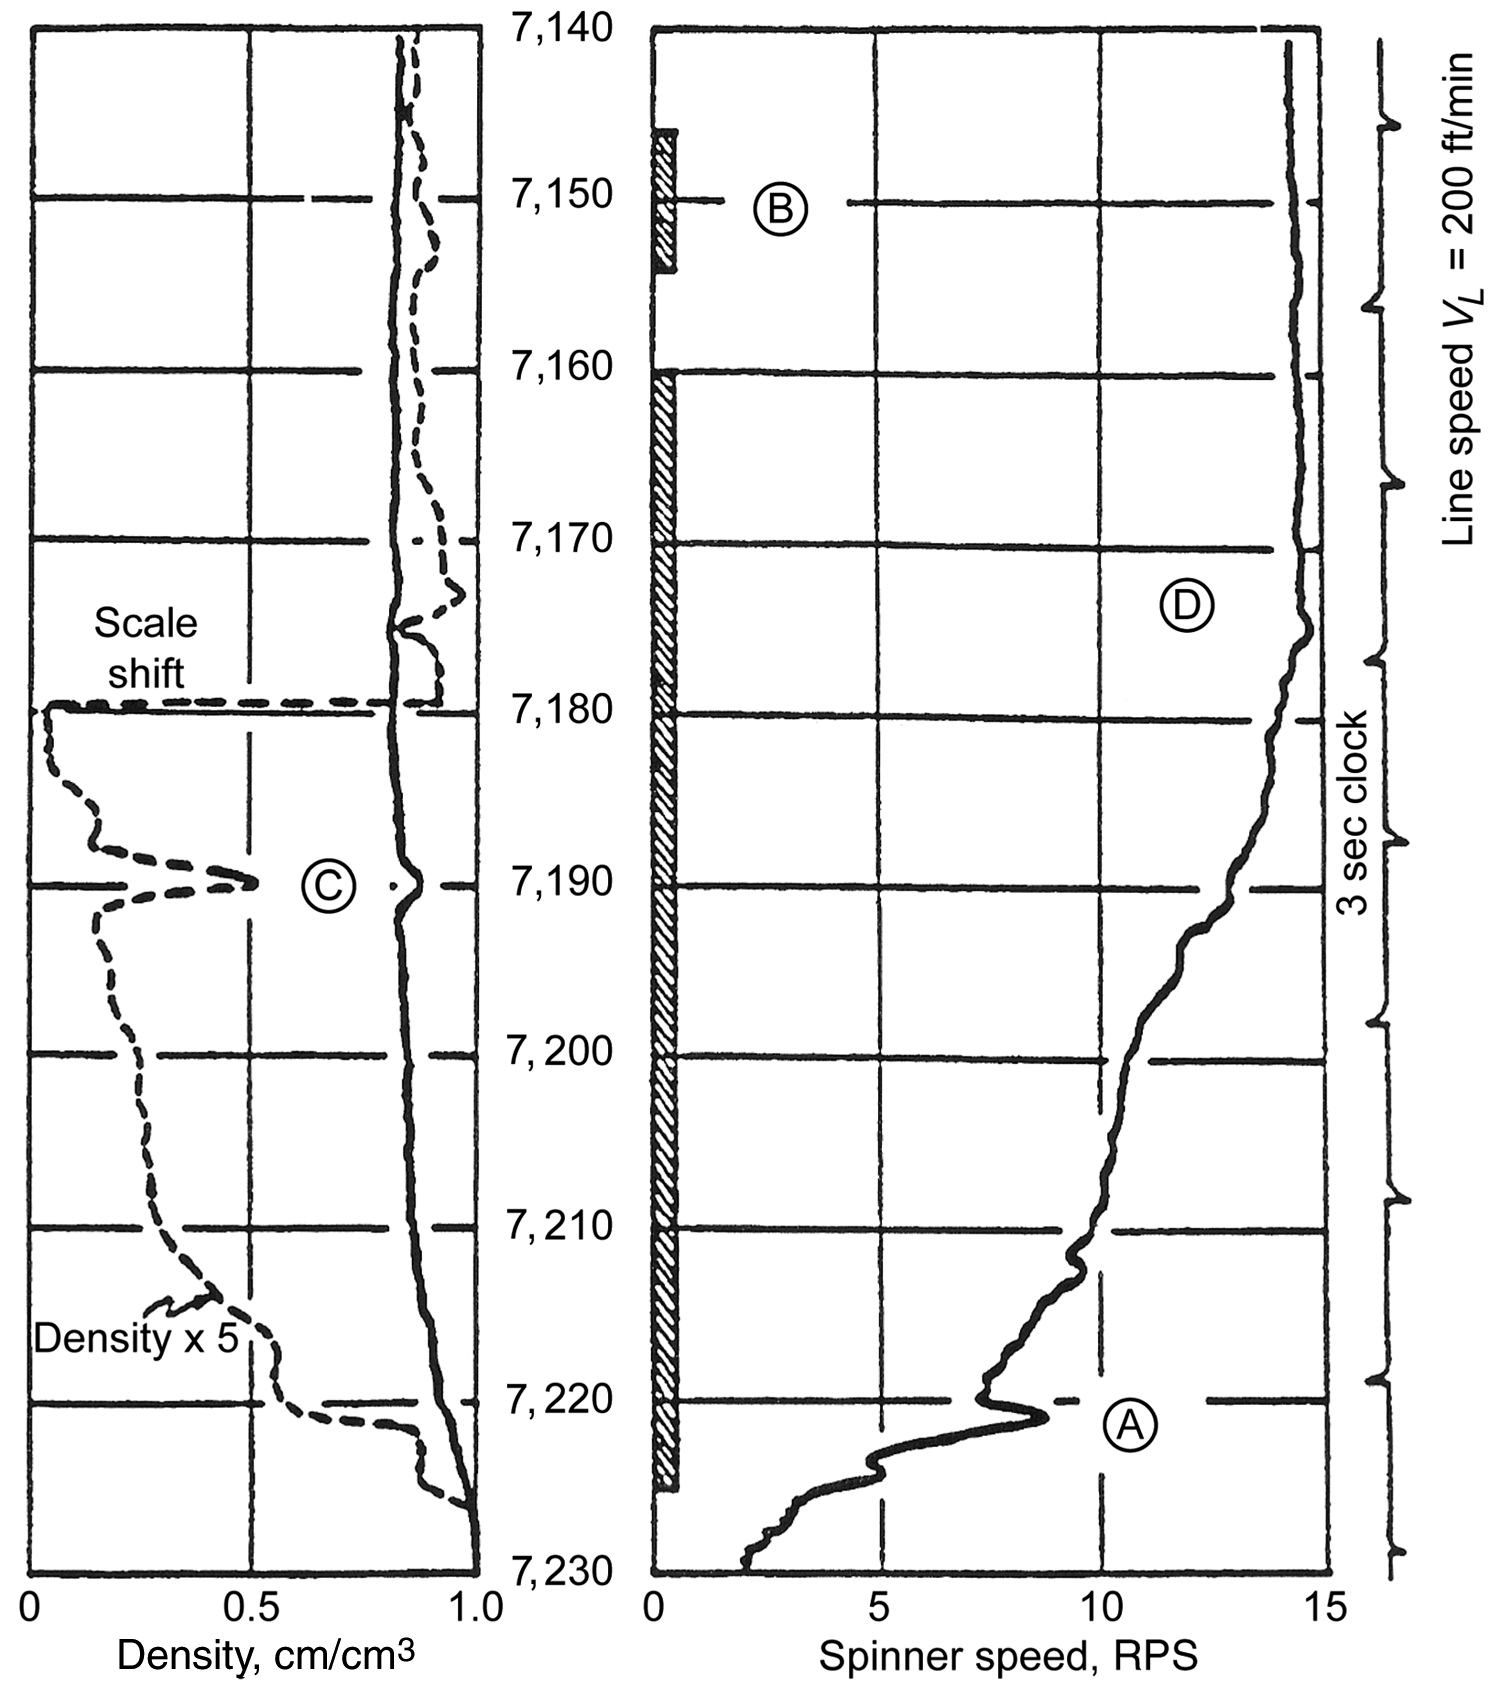
Fluid density (track 1) and spinner survey (tracks 2 and 3).
Well flowing 10,000 bpd. Density shows water density in sump
below perfs, oil density over perf interval. Spinner shows
increasing cumulative production over lower half of perfs.
The upper half of the perfs may have been ineffective or the
reservoir quality is so poor that no flow can be expected. A
competent forensic petrophysical analysis could answer
this question and a workover initiated if warranted.
Amplified fluid density curve shows slight decrease up to
7160 feet indicating some water in the oil below this depth
- this is the "water holdup".
|
|