|
 Formation TEMPERATURE BASICS
Formation temperature is an essential piece of knowledge
needed to calculate water resistivity, which in turn affects
the calculation of water saturation and oil and gas in
place. It may be measured with a continuous temperature log
or during a drill stem or production test. The more usual
method is to use the bottom hole temperature (BHT) recorded
on the well log heading, along with an assumed surface
temperature (SUFT), to create a temperature gradient graph.
From this, temperature at any depth may be determined.
1: Grad = (BHT - SUFT) / BHTDEP
2: FT = SUFT + Grad * DEPTH
Where:
SUFT = surface temperature for temperature gradient
(degrees Fahrenheit or Celsius)
BHT = bottom hole temperature (degrees Fahrenheit or
Celsius)
Grad = temperature gradient (degrees F / foot or degrees C
\ meter)
BHTDEP = depth at which BHT was measured (feet or meters)
DEPTH = mid-point depth of reservoir (feet or meters)
FT = formation temperature (degrees Fahrenheit or Celsius)
Many basins have local “hot spots”, with temperature
gradients much higher than the basin average. Water sature
will be too high and oil and gas inc place will be too low
if a low temperature gradient or low formation temperature
is used. instead of the correct one.
ESTIMATING
SURFACE TEMPERATURE
Temperature
measurements specific to your area of interest are going to
be sparse and you will have to do some searching for useful data.
The map below gives a good idea of what to use for surface
temperature (SUFT).
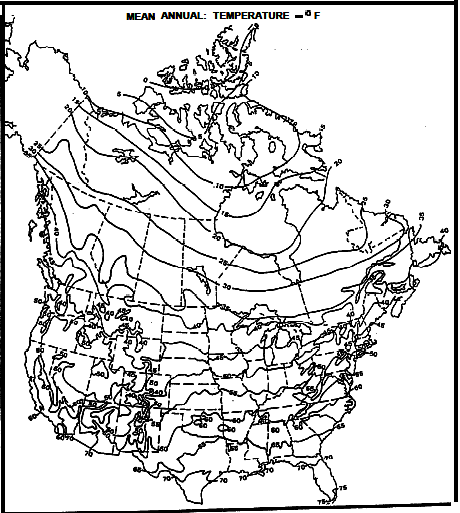
Mean Annual Surface Temperature Map for North America - degrees F
The 40 deg F contour follows roughly along the US-Canada border
except along the coast lines.
Contour interval is 5 deg F.
ESTIMATING
FORMATION TEMPERATURES
Temperature
versus depth data from log headings can be plotted to estimate a
best fit temperature gradient line. It doesn't have to be a straight
line. See representative graphs below. In areas with sparse data,
use the temperature gradient maps supplied below.
Typical Depth - Temperature profiles. Create your own by
best fit of BHT vs BHTDEP from data on log
headings or DST reports.

Temperature gradient for USA -
degrees Celsius per 1000 meters,
North American Heat Floe Map
(3 MB)
Legible Legend for NA Map
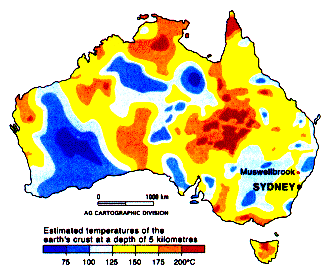
Temperature at 5000 meters for
Australia
|

