|
 Time to Depth Conversions
If we assume that we have a list of seismic times and corresponding
stacking velocities (Vstk) from a constant velocity stack, or
similarly derived seismic velocity analysis, we can calculate
the interval velocity between each velocity pick, provided we
also assume Vrms = Vstk. Average velocity and true depth are then
computed from the equations previously given, and presented in
tabular or in graphical form. The interval velocities will compare
with sonic log data, if the seismic processing, seismic data,
and sonic log data are of good quality.
Straight
ray depth is:
0: Dstr = Vstk1 * T1 /
2
Straight
ray depth is easy to calculate but is NOT the correct way to calculate
depth. Unfortunately, this conversion is still in common use.
Depths predicted by this method will be too deep by several hundred
feet in a 5000 foot well. You can compute it if you want to, but
DON'T USE IT.
Interval
velocity (as derived previously) is:
1: Vint = (((Vstk2 ^ 2) * T2 - (Vstk1 ^ 2) * T1) / (T2
- T1)) ^ 0.5
Interval
thickness is:
2: Hint = Vint * (T2 - T1) / 2
True
depth with curved ray path is:
3: Dtrue = Sum (Hint)
And
the average velocity is:
4: Vavg = 2 * Sum (Hint)
/ To
The
straight ray depth is always deeper (larger value) than the true
depth, so this simplification should not be used for time to depth
conversions. A typical graphical display of this kind of data
is shown below.
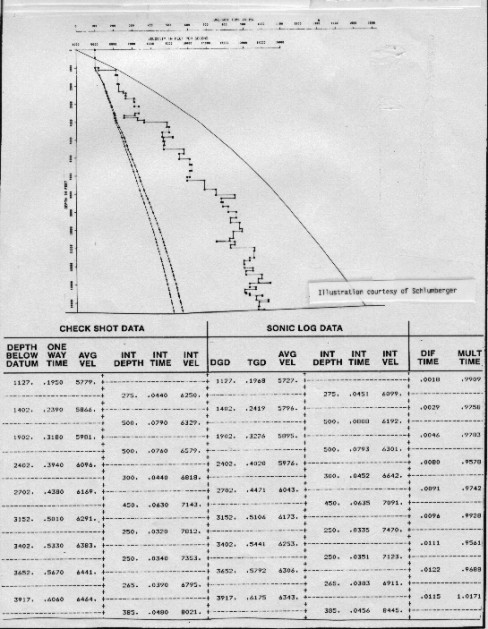
Velocity analysis results and time to depth graph
|