|
 CUMULATIVE FLOW CAPAcITY BASICS
Flow capacity is the product of permeability and reservoir
interval thickness: KH = Perm * THICK. The result is
measured in mD-feet or mD-meters. When summed across a
reservoir and normalized between 0 and 100%, it is called
the cumulative flow capacity or KH% curve. Flow capacity
translates directly into estimated productivity and
ultimately into cash flow.
The KH% curve is plotted versus depth on a scale of 0 to
100%, accumulated from the base of a reservoir to the top.
Thus the curve will gradually shift to the right as KH%
increasers upward.
There will be portions of the curve that are nearly vertical
and other portions with a slope toward higher KH%. Vertical
intervals show zones that failed cutoffs or with
insignificant flow capacity. Intervals showing slope on the
KH% curve are the best candidates for completion,
stimulation, or horizontal well placement. Intervals with a
vertical KH% curve are not good candidates for further
expenditures, regardless of their other apparent "good"
qualities..
The KH% curve will have the same shape as a spinner
flowmeter survey
on a production log. Since spinner surveys are not possible
in wells that cannot flow continuously to surface (eg.
pumping oil wells or uncompleted wells), the KH% curve may
be the only indicator of production potential in such wells.
It is also very much less expensive than a spinner survey or
a poorly planned completion.
Completing a well for production is a balancing act between
completion costs and production optimization. A high
quality petrophysical analysis that includes a permeability
calculation is a first step. The cumulative flow capacity (KH%)
curve, derived from that permeability, can help you make decisions about where to
complete the well, or where to place a horizontal well.
PERFORATION OPTIMIZATION
To save money, we try to minimize the perforation interval,
consistent with obtaining the maximum oil or gas production
rate, with minimum water or gas cap production. This usually means
perforating from the top of net pay to some deeper depth
within the net pay, omitting any intervals where the pay
flag is not turned on.
If there is a water contact in the reservoir, the lower depth
of the perfs should be as far above the contact as reasonably possible.
Aquifer influx will push oil up to the perfs over time. If
there is a gas cap, it is normally preserved until the oil
is produced, so the perfs are placed somewhat below the gas
cap to allow for gas cap expansion. When the oil is
depleted, the gas cap can be explored.
In gas-expansion-drive reservoirs, there is no significant
moveable water to worry about and the entire interval can be
perforated without fear of water production. Variations in
reservoir quality may make some portions look wetter than
others; these are just finer grained rocks and are still
worthy of being completed in many cases.
When vertical fractures exist, the perf interval must be as
far from both water and gas contacts as possible, and
drawdown pressure kept as low as reasonable, to reduce the
risk of gas or water inflow through the perfs.
OPTIMIZING
HORIZONTAL WELL PLACEMENT
The optimum position for a horizontal well is often
determined from a petrophysical analysis of the vertical pilot hole. The same rules
apply as for locating perforations. In both cases, you want
to complete the interval that will produce the most
hydrocarbons with the least complications. Stay above the
water, stay below the gas when trying for an oil well, stay out of
bounding shales or coal. In shale gas plays, the liquids-rich
interval may be the most desirable location, and this may be above a
leaner gas-only interval. A resistivity-at-bit and a gamma ray log
on the drill string will assist in steering the wellbore.
The initial location should be near the middle of the best flow
capacity in the desired reservoir, assuming that a hydraulic
fracture will be designed to penetrate both upward and downward to
cover the interval. In very thick reservoirs, there may be potential
to drill and frac more than one interval from the same drill pad or
platform.
CALCULATING THE CUMULATIVE FLOW CAPACITY (KH%) CURVE
Optimizing perforation interval
or horizontal well placement can be aided by creating
a cumulative flow capacity or productivity curve, based on the permeability
derived from the petrophysical analysis of the prospective
pay zone:
0: KHcuml = 0.0
1: KHi = Perm * INCR
2: KHtotal = SUM (KHi * PayFlag)
3: KHcuml = KHi + KHcuml
4: KH% = 100 - 100 * KHcuml / KHtotal
Where:
Perm = permeability of each incremental layer (mD)
INCR = log data sample rate (feet or meters)
KHi = flow capacity for each data sample increment (mD-ft or mD-m)
KHtotal = total flow capacity for pay interval (mD-ft or mD-m)
PayFlag = 0 if not Pay, = 1 if Pay
KHcuml = cumulative flow capacity (mD-ft or mD-m)
KH% = percent flow capacity (0% at base of pay, 100% at top of pay)
The KH% curve is presented with 0% at the left and 100% on
the right. This will match the shape of a spinner survey
from a flowmeter, with zero production capacity at base of
pay and 100% at top of pay.
Intervals with the steepest slope on the KH% curve are the most productive
and should be perforated if not too close to water or gas.
Where the KH% curve is near vertical, no perfs are required.
Place horizontal well at or slightly below midpoint of the
steepest slope of the KH% curve. This may vary depending on
frac design and rock mechanical properties.
Permeability does not have to be well-calibrated to use this
technique since the KH% curve is normalized between 0 and
100%.
Use the KH% curve to estimate increased productivity of
bypassed or unperforated intervals. See example below.
CAUTION: The KH% curve is only a guide. It may not always
indicate bypassed pay. The proof is in the production test.
EXAMPLES OF KH% LOGS
VERTICAL WELL RE-COMPLETION:
The objective is to consider whether the perforated interval is
optimized to obtain the best production characteristics consistent
with the cost of a workover, using the KH% curve as a qualitative
guide.

Grid lines are 1 meter spacing. Tracks 1, 2,
3 show GR, SP, PayFlag, resistivity, PE, neutron, and density
porosity.
Calculated and core porosity in Track 4 with saturations in Track 5,
calculated and core permeability in Track 6. Note excellent match to
core data (coloured dots). Higher SW in lower zone
is due to finer grained sand, not transition to water. KH% in Track
7 starts at base of PayFlag and runs up to top of PayFlag. Arrow
shows base of perforations. KH% curve shows 40% of possible flow
capacity has not been perforated. Since this is a gas expansion
drive reservoir, the perforations should be extended 2.2 meters to
capture at least 30% more flow capacity.
 HORIZONTAL
WELL PLACEMENT: HORIZONTAL
WELL PLACEMENT:
The objective is to consider where to place a horizontal well that
will optimize production and minimize stimulation costs, using the KH% curve as a qualitative
guide.
On the example shown at the right, the KH% curve is the second track
from the right (shaded pink), next to the lithology track. To the
left of the KH% track are permeability, saturation, porosity, and
apparent porosity distribution (including clay bound water, kerogen
effect, free gas, and water.
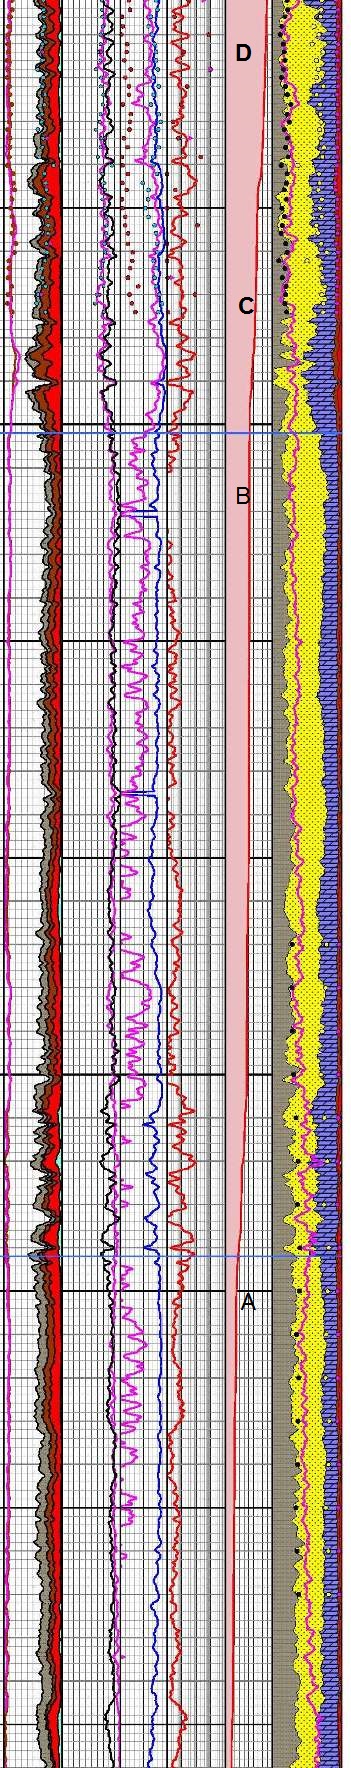
There are two long intervals on this log where the KH% curve has a
significant slope (Layers A and C), separated from each other by a
long interval with virtually no KH contribution (Layer B). Another
zone (Layer D) with virtually no KH contribution lies above Layer C.
In round numbers, Layer C has about 45% of the total well flow
capacity and the lower zone, Layer A, has about 40%.
An optimum location for a horizontal well would probably be near the
middle of Layer A or near the middle of Layer C, assuming a
hydraulic stimulation could be designed and executed that would
extend 25 meters (+/-) above and below the horizontal well. In this
example, either location offers about the same chance for economic
success.
Placing a horizontal well to access both Layers A and C is much more
difficult. The frac job would have to extend 75 meters (+/-) above
and below the well to access the good reservoir, while penetrating
30 to 40 meters of rock that would not contribute much extra
production. It may be more attractive to run two horizontal legs
from the same pad to access both layers independently.
|