|
 GAMMA RAY BASICS
Gamma ray logs are recorded in virtually every oil
and gas well drilled, and on most logs run in mineral exploration
prospects. In sedimentary rocks, shales are often more radioactive
than reservoir rocks such as sandstone, limestone, and dolomite
(although there are exceptions). The shape of the gamma ray log with
respect to depth assists in correlating layers from one well to
another, and for assessing depositional environment.
Of the 117 elements, 83 have more than one form,
or isotope. Isotopes are inherently unstable and, over time, decay to the lower
energy, stable form. The half life of an isotope may be millions of years,
days, or even milliseconds.
The most common isotopes are the uranium series, the thorium series, and potassium,
which has only one unstable isotope. These elements are found in nature, and amongst
other things, emit natural gamma rays that can be detected by a logging tool
in a borehole.
Each of the above elements naturally emits
gamma rays which are distinctive in both number and energy. One
gram of potassium 40 emits an average of 3.4 photons per second
at a fixed 1.46 MeV energy. But an equal weight of either thorium
or uranium produces respectively 12,000 or 26,000 gamma rays
per second with a spectrum of energies that average 0.5 MeV.
In the logging industry, gamma ray flux has been recorded in
micrograms Radium equivalent per ton (ug Ra equiv / ton) prior to
about 1960. After that time, logs were calibrated in API units based
on known radiation levels of artificial formations in test pits
located in Houston. The usual scale for old style logs was 0 to 10
ug Ra and 0 to 100, 0 to 120, or 0 to 150 API units for newer logs.
There is an exact conversion between ug Ra and API units but since
the old logging tools were rarely calibrated, this conversion is
seldom useful. The pragmatic solution is to multiply ug Ra by 10 to
obtain an approximate API units scale.
The counting rate at the detector in a gamma ray logging tool is naturally
influenced by the tool itself and the borehole environment. However, the primary
response will be related to the number of atoms per unit mass emitting gamma
rays.
Therefore, the effective gamma ray response due to
potassium 40, for a single compound is:
1: GRk = 6.02*10^23 * Nk * C / M
Where:
C = 0.000118 (relative abundance of K40 to K39)
GRk = number of gamma ray emissions
M = molecular weight of the rock
Nk = number of potassium atoms per gram
For a mixture:
2:
GRk = Sum (Wi * GRki)
Where:
GRki = gamma ray contribution of ith component
Wi = weight fraction of the ith component
An empirical relationship between effective potassium
content and gamma ray API units is reproduced below
for the standard gamma ray logging conditions of 8" borehole,
10 lb/gal mud and 3 5/8" scintillation NaI detector type
tool typical of the 1960 - 1980 era. Newer tools are more
sensitive and more linear. This relationship was originally developed by the author
while calibrating gamma ray log response to potash ore content
of sylvite beds in 1963. For other borehole environments refer
to appropriate borehole correction charts.
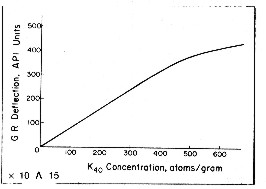 Some
tools are more linear than this one. The flattening effect
at high count rates is due to the dead time of the detector
system. Dead time is the time it takes to measure and transmit the recorded
pulse to the surface. For other tool types, with different
detectors and dead times, the relationship must be found by
calibration. Some
tools are more linear than this one. The flattening effect
at high count rates is due to the dead time of the detector
system. Dead time is the time it takes to measure and transmit the recorded
pulse to the surface. For other tool types, with different
detectors and dead times, the relationship must be found by
calibration.
GAMMA RAY DETECTORS
Four basic types of gamma ray detectors have been used since the inception
of radiation logging. These are ionization chambers, Geiger-Mueller detectors, proportional
counters, and scintillation detectors. Although proportional counters are
presently used only in neutron logging, the remaining three types have been
commonly used to make either gamma ray or neutron measurements.
The first
three types operate on the general principle of gas ionization caused by
incident gamma rays. Most middle aged and modern tools use scintillation
counters composed of sodium iodide (NaI) crystals. These emit a tiny
flash of light when struck by a gamma ray. The flash of light is
amplified by a photo-multiplier tube, which in turn generates an
electrical pulse. The pulses are counted by appropriate electronics
to provide the gamma ray count rate recorded on the log.
Scintillation detectors are more
efficient than gas detectors because they contain a greater mass
of radiation sensitive material. Also, their relatively small
size enables them to resolve thin beds much more accurately.
Scintillation detectors provide adequate resolution in formations
as little as three feet thick.
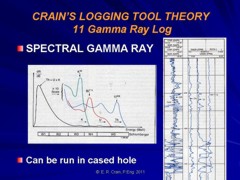
GAMMA RAY SPECTRAL LOG
In gamma ray spectral logging, the three
main gamma ray contributors, potassium (K), thorium (TH), and uranium (U), give gamma rays of different energy levels. By appropriate
filtering, the total gamma ray flux can be separated into the three components.
This aids petrophysical analysis as thorium is a good shale indicator when uranium
masks the total GR response. Thorium-potassium ratio and other combinations
of curves can be used for mineral identification and clay typing. Finally,
uranium counts can be subtracted from the total counts to give a uranium
corrected gamma ray curve that is easier to use and to correlate from well
to well.
Log scales may vary but uranium and thorium are usually scalle in
parts per million (ppm) and potassium in percent. Curve names may
also vary but POTA, URAN, and THOR are common.
Although total gamma ray is also presented on the log in API units,
it is sometimes useful to recalculate the total GR from the
elemental GR breakdown:
1: GRtotal = 4 * THOR + 8 * URAN + 16
* POTA
Where: URAN and THOR are ppm and POTA is in %. GRtotal is in
API units.
If uranium is known in ppm, total gamma ray can be corrected for
uranium with:
2: CGR = GRtotal - 8 * URAN
This makes it easier to use the GR as a shale indicator, especially
in unconventional (gsa shale) reservoirs.
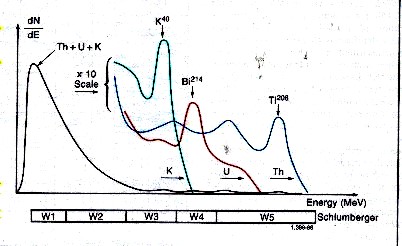
Spectral breakdown of total GR into five energy windows, leading
to the segregation
of total counts into three major components - potassium,
thorium, and uranium.
Gamma rays emitted by the formation rarely
reach the detector directly. Instead, they are scattered
and lose energy through three possible interactions with the rocks;
the photoelectric effect, Compton scattering, and pair production.
Because of these interactions and the response of the sodium
iodide scintillation detector, the spectra are degraded to
the rather “smeared” spectra shown above.
The high-energy part of the detected
spectrum is divided into three energy windows, W1, W2, and
W3; each covering a characteristic peak of the three radioactivity
series. Knowing the response of the tool and the number of
counts in each window, it is possible to determine the amounts
of thorium 232, uranium 238, and potassium 40 in the formation.
There are relatively few counts in the high-energy range where
peak discrimination is best; therefore, measurements are subject
to large statistical variations, even at low logging speeds.
By including a contribution from the high-count rate, low-energy part of
the spectrum (Windows W4 and W5), these high statistical variations in the
high-energy windows can be reduced by a factor of 1.5 to 2. The statistics
are further reduced by another factor of 1.5 to 2 by using a filtering technique
that compares the counts at a particular depth with the previous values in
such a way that spurious changes are eliminated while the effects of formation
changes are retained.
|