The petrophysical plan also helps to acquaint management, the client, and other groups who rely on the petrophysical results, with our methods and data requirements. Since integration of petrophysical data with larger projects is one of the important goals, guidelines on how to handle these relationships are described here. Petrophysics
is often a step by step procedural process. However, a number
of motherhood statements are understood to be included (eg. thoroughness,
diligence, persistence, quality, resources). Although we all know
that these factors are important, most unhappy clients, blown
budgets, and delayed deadlines are caused by forgetting these
basics.
1.
Geophysical Phase
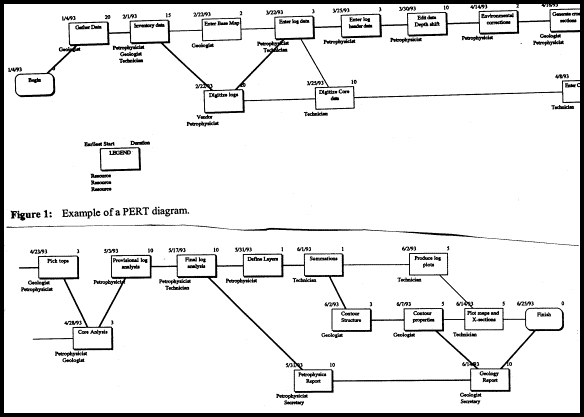
Although the phases appear to be sequential, there is considerable overlap and feedback between phases. Careful planning of all phases, and special attention to the inter-relationships between phases, will provide the optimum results and minimize costs. For example, all Phases require log data, but of different types, intervals, scales, accuracy, and at different times in the life of the project. A decision has to be made as to who does the digitizing, who checks it, and is it done once for all to use, or done as needed by each group? Similarly, Petrophysics requires core porosity vs permeability transforms and capillary pressure water saturation vs porosity relationships at an early stage; reservoir engineering needs this data much later. Should reservoir engineers provide this data to the log analysts, or vice versa? The same questions must be answered with respect to petrographic data, fluid properties and contacts, geological structure, and other reservoir description data. All of this data is required by more than one of the Phases, but at different times. Once decisions are made as to who does what, the project manager, and phase managers, must follow up to be sure the various tasks are being accomplished correctly and on time, and what other resources might be needed to help finish.
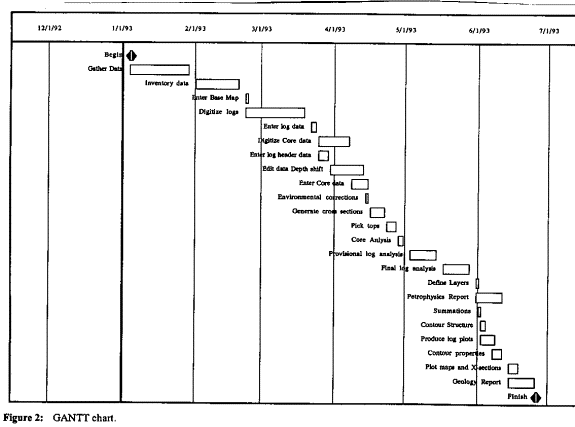
Better definition of resource needs and resource conflicts can be seen on Gantt charts.
Problems show up even more clearly on a Resource Gantt chart.
Although easy to make, these charts require constant updating, usually weekly. However, the effort is rewarded by catching resource deficiencies or conflicts before they proceed too far. The three illustrations shown above are from an article by my good friend Robert Elphick, published in SPWLA Log Analyst, Dec 1992. Additional entries on the Resource Gantt chart are helpful. For example, showing the timing of all inputs (source data) and outputs (deliverables) for a resource will show up conflicts that are not apparent in the resource allocation bars. The output of one Phase is often the input to another Phase. Assigning people to a Phase when their inputs are not available produces nothing but frustration. While resources may need re-allocation to overcome some obstacles, this may incur some penalty due to broken continuity or loss of man-power. Adding people to a team has diminishing returns, which set in when a team exceeds 6 or 7 people. Conversely, adding or speeding up hardware and software usually has immediate, low-cost benefits, provided of course that these resources are truly tested and ready for release in a real-world environment. Regular meetings of all Phase leaders are needed to keep the various activities coordinated. These should be short, have an agenda distributed in advance, and be adjourned promptly when the agenda is exhausted. Smaller meetings may follow to correct specific problems, but not all Phase leaders need to be present. If a Phase has a number of staff, Phase meetings may be needed to assemble progress data before the formal weekly meetings. Brief written weekly and monthly progress reports should be distributed to Phase leaders and the client.
Open hole logs will be used to determine shale volume, effective porosity, water saturation, permeability, and (where possible) lithology. Cased hole log analysis will be performed, as needed, to assist in determining production characteristics, fluid movements, and dated fluid contacts. Swept zones, sweep efficiency, and residual oil saturation in partially depleted reservoirs can often be determined from modern open and cased hole logs. Results will consist of summary tables of pore volume, hydrocarbon pore volume, flow capacity, average porosity, average water saturation, average permeability, and net pay after application of cutoffs and layer depth criteria. These results will be used to generate reservoir property maps for estimation of original oil in place and flow capacity. The maps will be supported by detailed depth plots and listings of all input and computed data. Results will be used as input to the Reservoir Engineering and Reservoir Simulation Phases of the project, and also to assist in final assessment of mapping performed in the Geological Phase. Reservoir zonation is often determined in the Geological Phase, in which formation tops, stratigraphy, facies, structure, and isopach maps will be prepared for use in the Petrophysical Phase. Mapping of petrophysical results and determination of volumetric original oil in place is usually done as part of the Reservoir Engineering Phase, but may be delegated to the Geological or Petrophysical Group.
1.
a petrophysical manager/analyst. It is common to see Resources #1, 2, and 3 combined in one human brain/body. If timing constraints do not interfere, this approach gives good results. Digitizing (Resource #6) is often done better by the log analysis technician (Resource #3) because he/she has a vested interest in the quality of the work. Another option is an out-of-house service bureau whose primary business is digitizing logs. Quality control of this function is critical, as all Phases of the project depend on a clean, complete, correct database. Resources #11 and #12 are also important concerns and control time and budget over-runs as much as the individual actions of the Petrophysical Team.
If data is known or suspected to exist, it must be pursued diligently and persistently until all avenues are exhausted. If required data is truly not available, the client should be notified of the consequences immediately, along with a recommendation for additional work required to overcome the deficiency. For petrophysics, the missing data is often the electrical properties, petrographics, mineralogy, water chemistry/salinity, and core porosity-permeability-grain density data we need to calibrate the log analysis. The cooperation of the client in data gathering is critical. Data that is overlooked or deliberately held back reduces the quality of the results, to the detriment of the project and everyone involved in it, including the client representatives. A copy of the data inventories should be given to the client, with a request to review and augment the database where possible. A complete list of data required for petrophysics is listed below. Much of the data listed is needed by more than one Phase. However, each Phase should prepare its own data gathering list, so that all required data is properly itemized. The combined data gathering list should be provided to the client before the data gathering trip to acquaint them with our needs and expedite the gathering process. To obtain optimum results, the petrophysical team requires all pertinent well data in a timely manner. If some requested data is not available or arrives late, it may not be possible to calibrate petrophysical results adequately. In such cases, a discussion of the data deficiencies will form part of the final report.
If other Phases prepare log digits for their own use, they should coordinate their efforts with Petrophysics to minimize duplication. The digital log database must reside on one computer under the control of the Petrophysical Team. This database is termed the Master Petrophysical Database and cannot be removed or modified except by authorization of the Petrophysical Manager. It will be backed up on a weekly basis for safety, with a copy held off premises. The integrity of the Master Petrophysical Database is a critical function, and is the responsibility of ALL petrophysical staff. Problems or deficiencies in data or procedures should be reported immediately to the Petrophysical Manager. Copies of the Master database may be distributed to other computers or workstations. However, this data becomes the responsibility of the users on those workstations. At least one copy of the data should be in read-only files on the workstation so that users cannot corrupt the files accidentally. Users may copy these files to their own directories for their own use. If accidents occur, the data can be revived from the read-only files. If a distributed copy is in use, it is the responsibility of the user to request updates and to report problems to the Petrophysical Manager. However, users have a responsibility to make every effort FIRST to confirm and define the problem by comparing their data with the read-only files and the hardcopy logs. Log data quality control will be undertaken by the Petrophysical Team as the database is being prepared. If problems are identified to be caused by inadequate in-house digitizing, further training will be implemented. Service bureau digitizing will be rejected if errors are not corrected quickly.
1.
If data is provided in digital form, load and print catalog of
all known data files and compare to data inventory. If data is
digitized in-house, proceed as detailed below.
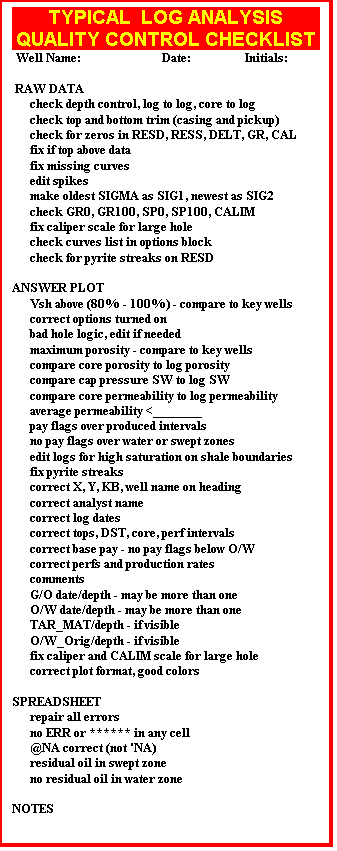
1. Gather and inventory available data, review well files, sample descriptions, drilling history, drill stem and production tests, completion and production history, and current status of each well, based on information in the well history files provided by the client. 2. Review conventional and special core analysis data and core description on the cored wells, and enter all data into database. View available cores and describe fracture patterns and lithology. Initiate and monitor further core analysis if required. 3. Prepare core porosity vs core permeability, and vertical vs horizontal permeability crossplots (by zone by well and by zone all wells) and determine best fit equations for each zone. Revise transforms after water saturation data has been calculated and calibrated to capillary pressure data. 4. Crossplot porosity vs formation factor and saturation vs resistivity index from special core data, by zone by well, and by zone all wells combined. Determine appropriate electrical properties (A, M, and N) values from available special core studies, from modern EPT/MSFL logs, and/or from Pickett plots if suitable water zones exist. 5. Prepare log database and print inventory of available logs by reading digital data (provided by the client) over required intervals, digitizing any missing curves or logs according to accepted log digitizing specifications. CHECK INVENTORY AGAINST HARD COPY LOG HEADINGS. The curve complement will vary with the age of the logs, but will include deep and shallow resistivity, sonic, neutron, density, SP, gamma ray, photoelectric, and thermal decay time where available. Additional curves will be added as needed and where available. Old style neutron logs will be converted to a porosity scale. All data will be decimated to 1 foot or 0.3 meter increment. 6. Plot all raw data and core data vs depth. Compare to original logs to verify scales, data quality, depth matching, and missing data. THIS IS AN ABSOLUTELY ESSENTIAL QUALITY CONTROL STEP AND MUST NOT BE OMITTED. 7. Prepare initial log analysis and representative crossplots on cored intervals on key wells with modern log suites to calibrate porosity and permeability parameters, using the density-neutron-PE shale corrected complex lithology three mineral model for both shaly sands and carbonates. Shale volume will be determined from SP, GR, and density neutron crossplot (some methods are not appropriate in some zones). Only those crossplots that are necessary for choosing parameters will be made, but not all will be presented to the client. 8. Select appropriate water resistivity and mud filtrate value for each zone and select appropriate calculation method for original reservoir and invaded zone water saturation. 9. Determine effect of conductive non-clay minerals and adjust saturation accordingly. 10. Adjust parameters as required and calculate final log analysis on cored wells, to obtain a good match to core data. 11. Calculate log analysis on remaining wells with density-neutron-PE data, but no core data. 12. When no PE is available, a 2 mineral model will be used. For old style neutron cases, lithology will be assumed using log analysis on offset wells or sample description for control. 13. Calculate log analysis using the shale corrected sonic log model for wells with core and/or density neutron data, to calibrate sonic parameters. 14. Calculate log analysis on remaining wells which have only sonic log data. 15. Perform similar steps for wells with density only or neutron only, calibrating to core or offset density neutron or sonic data. 16. Demonstrate calibration of log analysis porosity to core porosity using depth plots, crossplots, and/or regression analysis. 17. For wells with ancient logs, determine approximate porosity from porosity mapping of offset wells, to aid in determining net pay in these wells. 18. Determine secondary porosity, fracture location and fracture intensity from all available methods. 19. After a few of each log suite are analyzed, write preliminary report and review preliminary results with client, geology team, engineering team, and compare to geological cross sections and zoning concepts, as well as reservoir engineering results. 20. Revise any methods or parameters and analyze remaining wells. 21. Prepare cross sections to include all wells and compare shale, porosity, lithology, saturation, permeability, and fluid contacts from well to well. Check for consistency, geological variations, data errors, and analysis errors using Quality Control Checklist. 22. Compare results to geological zoning and run final layer summaries. 23. Calculate dated water saturation from thermal decay time log where available, and compare to original water saturation from resistivity logs. 24. Determine and justify (if possible) shale, porosity, permeability, and water saturation cutoffs by comparing log analysis results to core data, production, and test data. 25. Determine original and dated gas/oil and oil/water contacts to define gross intervals, checking with production and test data, properly adjusted for capillary pressure data and age of well. 26. Correlate capillary pressure curves and log analysis saturations over transition zones. 27. Calculate and print average porosity, average saturation, pore volume, hydrocarbon pore volume, flow capacity, and productivity summaries for each layer in each zone for mapping of reservoir properties. 28. Prepare depth plots of raw data and answers for wells with any useable log curves and results at scales of 1:200 and 1:500, for correlation and mapping purposes, showing formation analysis results, core analysis porosity and permeability (where available), flags for bad hole, light hydrocarbons, and pay intervals, and other requested curves. 29. Annotate tops, tests, cores, perfs, and fluid contacts on depth plots. Add annotation tail with this data, parameters used, and pay zone summaries. 30. Print detail listings of all requested results for all zones. 31. Present copies of necessary crossplots for each zone, with discussion and explanation. 32. Write final report, documenting calculation methods, parameter selection, results, and conclusions, and discuss results with client. 33. Prepare copies of IBM compatible data tapes or discs in LIS or LAS format containing raw data and results. 34. Provide copies of results to other Phases as required through the duration of the project.
1. Sample description, including hydrocarbon shows, porosity indications, fractures, lithology, and gas kicks. 2. Hole mechanics, including size, shape, roughness, solution, caving, casing, and mud type, weight and salinity. 3. Drill stem test results, including recovery amount and type, flowing pressures, formation pressure, and mechanical details. 4. Core data, including porosity, permeability, grain density, lithology description and saturation. 5. Production data, including fluid type and amounts, and mechanical details. 6. Offset data, including log values, interpretation parameters, results, and of course, all the above mentioned items on the offset wells. 7. The assumptions you made concerning interpretation parameters and analysis methods. in a good analysis, all these factors should corroborate each other. If they do not, you are missing something or some of your data is WRONG. Do
not believe every core, DST, or perf test. They may not be from
the zone they are supposed to be evaluating.
However, DST data does not have any method of correlation, and we must presume the same frequency and amount of depth adjustment as core data is needed. Therefore DST's are often off depth compared to logs. Perf tests can be located correctly, because there is usually a correlation log, but they may produce from elsewhere in the hole due to mechanical problems, such as channels in the cement, holes in the casing, tubing or liners, or bad bottom plugs. Many cased hole logs may be run to confirm or discount mechanical completion problems. A usual requirement of a log analysis is that it matches core data. Do not be overly concerned about this, but a reasonable match is usually possible and expected. The amount of the depth error may not be clearly discernable by observation of the porosity curve. The core gamma would be needed to find the correct adjustment. Variation of one or two percent porosity is common and acceptable, with the core usually being high. In unconsolidated sands, the core can be 5 - 10% porosity too high. A second requirement is that hydrocarbons be shown on the analysis over the interval that tested hydrocarbon, and that water be shown where the well produced water. This is not easy - and many zones will show water or hydrocarbons where the DST or perf test does not, especially in shaly sands. Many water tests are really producing mud filtrate, so take care to distinguish this possibility. A good analysis is one that can be reconciled with the facts, without involving mystical powers or miracles. Adjustments of analysis parameters are generally needed if agreement is very poor. Some zones just do not look good on logs, yet produce prolific quantities of oil or gas, such as the Viking in Central Alberta or the Austin Chalk in the Gulf Coast of the USA. Residual hydrocarbon, bitumen, or pyrobitumen and heavy oil can cause many zones to be apparently attractive on logs yet produce water, filtrate, or nothing on drill stem tests. Try to identify this potential problem from sample or core description or by moved hydrocarbon analysis. A similar problem occurs in tight gas sands, where the zone truly can produce gas, but the DST recovers mud filtrate or formation water, but little gas. The most common error of all is accepting density log data in rough or large hole - do not be fooled by this. Use the sonic or the neutron log corrected for shale to see how valid the density log data might be. DO NOT USE THE DENSITY LOG IF IT IS INCORRECT!!! Experience and common sense are the best quality control. Just because it’s your play, do not make it look too good just because one log can be used to document your case (and three others contradict it). Whether you do an analysis for yourself, your company, or for hire, the following proviso should be understood by all parties involved:
Keep
in mind that most service companies use a clause similar to this
one and you should understand the implications of it before you
start any logging operation at a wellsite. |
|
||||||||||
|
Page Views ---- Since 01 Jan 2015
Copyright 2023 by Accessible Petrophysics Ltd. CPH Logo, "CPH", "CPH Gold Member", "CPH Platinum Member", "Crain's Rules", "Meta/Log", "Computer-Ready-Math", "Petro/Fusion Scripts" are Trademarks of the Author |
|||||||||||

|
||
| Site Navigation |
MANAGEMENT INTEGRATED PETROPHYSICAL PROJECTS |
Quick Links |


 Many
cores range from one to fifteen meters off depth compared to logs.
Since this can usually be identified by the core gamma ray log
or the shape of the porosity distribution, it can easily be cured.
Many
cores range from one to fifteen meters off depth compared to logs.
Since this can usually be identified by the core gamma ray log
or the shape of the porosity distribution, it can easily be cured.