|
 Porosity from the Density Log
The density log is widely used to estimate porosity. The method
works well when shale volume and matrix rock density are
accurately known. Errors as large as 12% porosity can occur,
and 3 to 6% are common if incorrect assumptions are made.
If both density and neutron logs are available, a superior
model that does not require matrix rock properties is the
Shale Corrected Density Neutron
Complex Lithology Crossplot Method. The Meta/Kwik
spreadsheet for this model is available at
Downloads and Spreadsheets.
Density Log RESPONSE EQUATION
The response equation for the density log in porosity units follows
the classical form:
1:
PHID = PHIe * Sxo * PHIDw (water term)
+ PHIe * (1 - Sxo) * PHIDh (hydrocarbon term)
+ Vsh * PHIDsh (shale term)
+ (1 - Vsh - PHIe) * Sum (Vi * PHIDi) (matrix term)
Where:
PHIDh = log reading in 100% hydrocarbon
PHIDi = log reading in 100% of the ith component of matrix rock
PHID = log reading
PHIDsh = log reading in 100% shale PHIDw = log reading in 100%
water
PHIe = effective porosity (fractional)
Sxo = water saturation in invaded zone (fractional)
Vi = volume of ith component of matrix rock
Vsh = volume of shale (fractional)
To solve for porosity from the density log, we assume PHIDh, PHIDi,
PHIDsh, PHIDw, and Vsh are known. We also assume PHIDw = PHIDh and
Sxo = 1.0 when no gas is present. If gas is indicated, we make
assumptions about PHIDh and Sxo, usually in the form of a correction
factor to the gas free case, as described later.
This response equation is rigorous. Mineral and fluid parameters
are shown HERE. Shale properties are selected from
the log in an obvious shale zone.
References:
1. Logging Empty Holes
C.G. Rodermund, R.P. Alger, J. Tittman,
Oil and Gas Journal, 1961
2. Formation Density Log Application in Liquid-Filled Holes
R.P. Alger, L.L. Raymer, W.R. Hoyle , M.P.
Tixier, JPT, 1964
3. Litho-Density Log Interpretation
J.S. Gardner, J.L. Dumanoir, SPWLA,
1980
POROSITY FROM Density Log
Calculate density porosity from density data.
2: PHID = (DENS - DENSMA) / (DENSW - DENSMA)
Apply density shale correction:
3: PHIDSH = (DENSH - DENSMA) / (DENSW - DENSMA)
4: PHIdc = PHID - Vsh * PHIDSH
Apply density gas correction.
5: IF DENSITYGASSWITCH$ = "ON"
6: THEN PHIdc = KD * PHIdc
Where:
DENS = density log reading in zone of interest (gm/cc or kg/m3)
DENSMA = density log reading in 100% matrix rock (gm/cc or kg/m3)
DENSSH = density log reading in 100% shale (gm/cc or kg/m3)
DENSW = density log reading in 100% water (gm/cc or kg/m3)
KD = density log gas correction (fractional)
PHID = porosity from uncorrected density log (fractional)
PHIdc = porosity from density log corrected for shale (fractional)
PHIDSH = apparent density log porosity of 100% shale (fractional)
Vsh = shale volume (fractional)
COMMENTS:
A graphical solution, with shale correction, is shown below.
Chart for Estimating Shale Corrected Density Porosity
The
density log corrected for shale is a very good approximation to
porosity, but the log was not common before 1965, so sonic or
neutron methods may be necessary for wells drilled before that
time.
KD is in the range of 0.5 - 1.0 depending on invasion, gas density
and local experience. A correction is almost always needed if
gas is present.
Use gas correction only if PHIdc is too high compared to other
sources and if gas is known to be present. This correction may
be necessary even in shaly sands, since the depth of investigation
of the density log is deep enough to see beyond the flushed zone.
WHEN DENSITY LOG IS IN POROSITY UNITS, POROSITY MAY BE WRONG
BECAUSE THE POROSITY SCALE DOES NOT MATCH THE ROCK MINERALOGY.
SEE NEXT SECTION FOR CORRECTIONS.
If density porosity data is in percent, rather than fractional,
divide the data values by 100 before Step 2 and 3 are applied.
No compaction correction is made to density log data.
NUMERICAL EXAMPLE:
1. Assume a zone with:
DENS = 2.15 gm/cc
DENSW = 1.00 gm/cc
DENSMA = 2.65 gm/cc
Vsh = 0.33
DENSSH = 2.60 gm/cc
PHID = (2.15 - 2.65) / (1.00 - 2.65) = 0.30
PHIDSH = (2.60 - 2.65) / (1.00 - 2.65) = 0.03
PHIdc = 0.30 - 0.33 * 0.03 = 0.29
No gas correction is required.
Porosity From Density Log With Matrix Offset
One step that is often required is to convert apparent porosity
on the density log into density units, then reconstitute porosity
from this value corrected for a desired matrix and fluid value.
This is done by rearranging the response equation of the previous
section.
Calculate density from density porosity.
7: DENS = (PHID * KD1 + (1 - PHID) *
KD2
Where:
English Units
Metric Units Log Scale
KD1 1.00
1000
All
KD2 2.65
2650
Sandstone
KD2
2.71
2710
Limestone
KD2
2.87
2870
Dolomite
Calculate shale density.
8: DENSSH = (PHIDSH * KD1 + (1 - PHIDSH)
* KD2
Calculate porosity with new matrix and fluid.
9: PHIDm = (DENS - DENSMA) / (DENSW - DENSMA)
10: PHIDSHm = (DENSSH - DENSMA) / (DENSW - DENSMA)
11: PHIdc = PHIDm - Vsh * PHIDSHm
Apply density gas correction.
12: IF DENSITYGASSWITCH$ = "ON"
13: THEN PHIdc = KD * PHIdc
Where:
DENSSH = density log reading in 100% shale reconstituted from
density porosity data (gm/cc or kg/m3)
DENS = density value reconstituted from density porosity data
(gm/cc or kg/m3)
DENSMA = matrix density (gm/cc or kg/m3)
DENSW = fluid density (gm/cc or kg/m3)
PHID = porosity from uncorrected density log (fractional)
PHIdc = porosity from density log corrected for shale (fractional)
PHIDm = density porosity log reading corrected for matrix offset
(fractional)
PHIDSH = density porosity log reading in 100% shale (fractional)
PHIDSHm = density porosity log reading in 100% shale corrected
for matrix offset (fractional)
Vsh = volume of shale (fractional)
COMMENTS:
See previous Section above.
ANCIENT DENSITY LOGS
Ancient density logs,
and many modern slimhole density logs,
are recorded in gamma ray counts per second. You get to work out
the transform to density using a semi-logarithmic High - Low
porosity technique as described for the neutron log. Here, high
count rate = low density = high porosity. Semi-log crossplots of
count rate versus core density or core porosity will calibrate the
method. These tools have a single detector and are not compensated
for borehole effects. Slim hole versions were widely used in strat
holes and in mineral exploration projects. Charts for some specific
tools can be found in the literature, such as the one shown below.
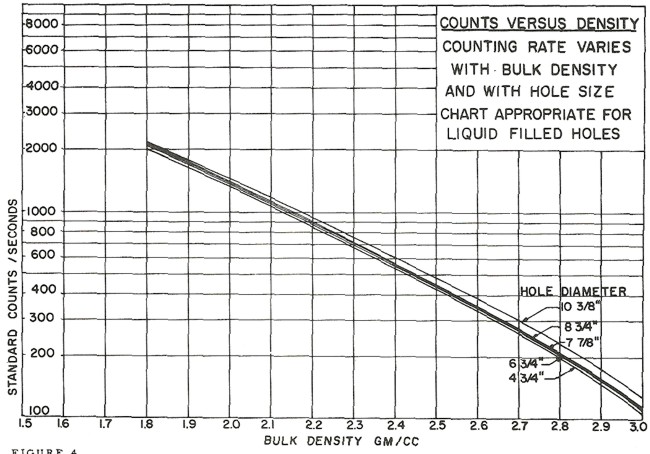
Counts per second to density transform for a Schlumberger PGT-A
density tool. Each tool iteration and each service company requires
a specific chart. Density varies with hole size mud weight,
and , An equation for the 8 inch borehole case is DENScps =
-0.88 * LOG(CPS) + 4.71
These tools are severely affected by hole size, mud weight, mud cake
thickness, source type and strength, source detector spacing, and
detector efficiency. The High-Low calibration method compensates for
all these problems, but available charts do not. In the earliest
versions of these tools, the source strength decayed rapidly, so
count rates definitely need to be normalized on a well by well
basis.
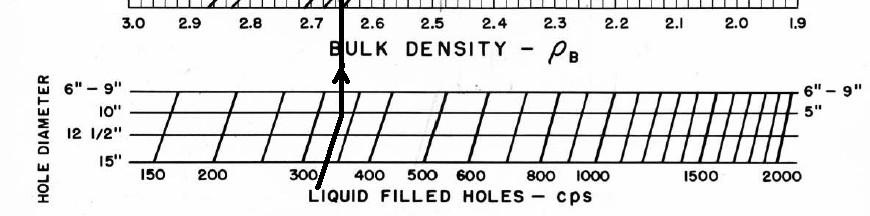
Most density transforms never made it into
published chart books. This one did -
Schlumberger PGT-C or D density count rates to porosity. Additional
charts are available to correct for mud cake thickness and mud
weight, and for air-filled holes. The count rate charts appeared in
1966 chart books, well after they were no longer needed, and
disappeared after 1968. Most density count rate charts are
very hard to find unless you have a good supply of ancient chart
books from 1958 through 1968 - a 10 CD set of ancient chart books was published by Denver
Well Log Society and sold through
SPWLA.
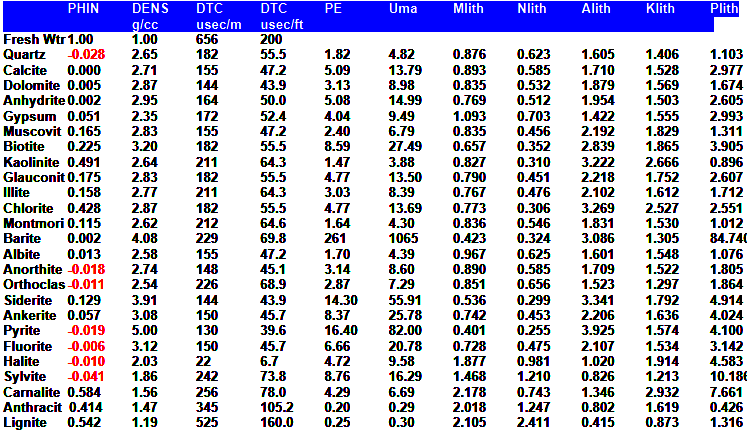
DENSITY LOG PARAMETERS

|